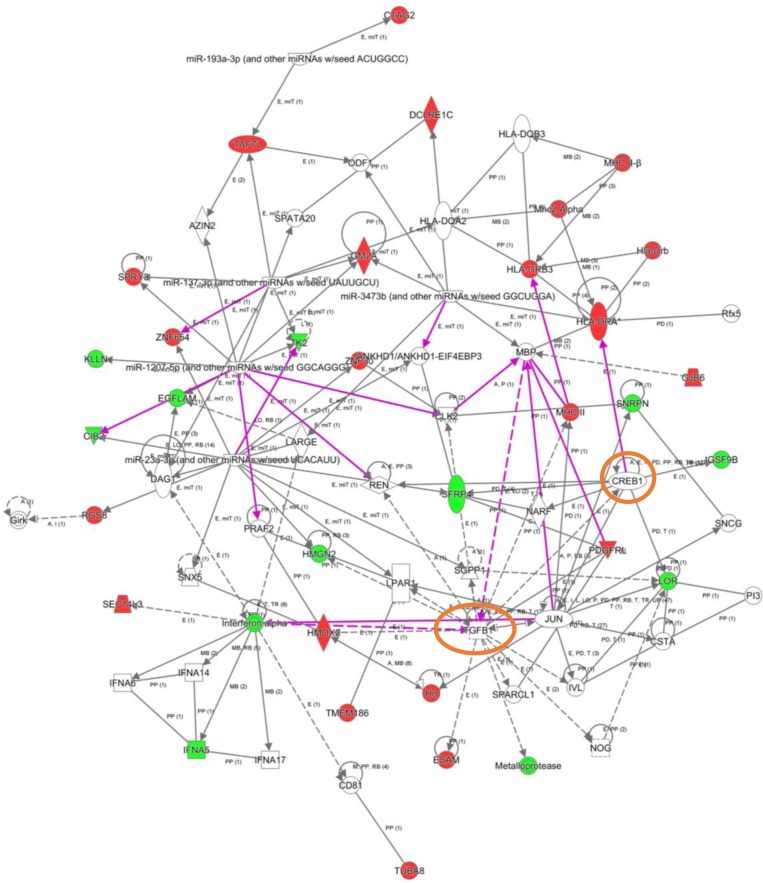
Figure 6. High-scoring gene interactome map for OB differentially expressed genes in intermediate AD stages.
Visual representation of the relationships between differential expressed genes and functional interactors in intermediate stages. In this case, two networks were merged to facilitate the global interpretation (purple lines correspond to novel functional links after merging). Dysregulated genes are highlighted in red (up-regulated) and green (down-regulated). Continuous and discontinuous lines represent direct and indirect interactions respectively. The complete legend including main features, molecule shapes, and relationships may be found at http://ingenuity.force.com/ipa/articles/Feature_Description/Legend.

