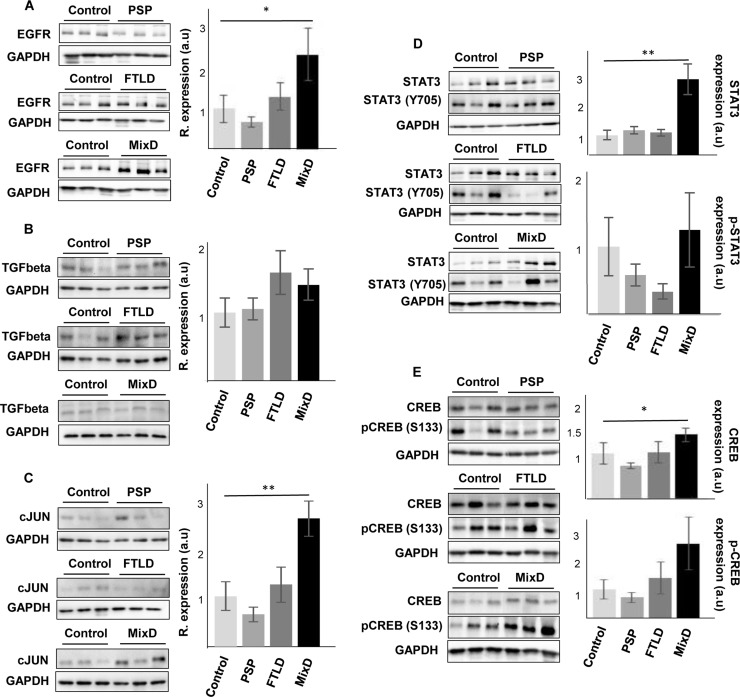
Figure 9. Olfactory bulb protein expression of EGFR, CREB1, TGF-beta, c-Jun and STAT3 across proteinopathies.
OB Protein expression was documented by Western blot. (A) EGFR expression, (B) TGF-beta expression, (C) c-Jun expression, (D) STAT3/phospho-STAT3 (Y705) expression, and (E) CREB/phospho-CREB (S133) expression, in PSP, FTLD, and mixed dementia subjects. Graphs represent histograms of band densities. Data are presented as mean ± SEM from: Controls (n = 4 cases), PSP (n = 9 cases), FTLD (n = 6 cases), and mixed dementia (mix AD VD) (n = 9 cases). *P < 0.05 vs control group; **P < 0.01 vs control group.

