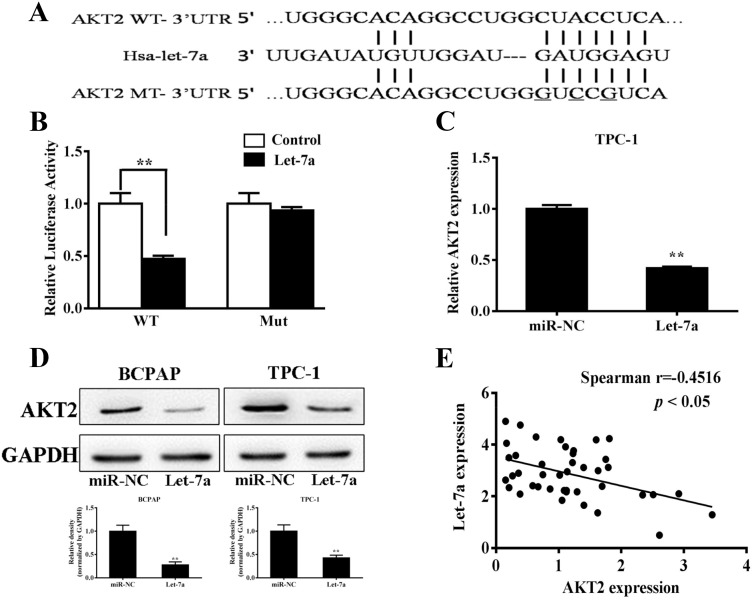
Figure 3. AKT2 was a direct target of let-7a.
(A) Putative seed-matching sites or mutant sites (underlined) between let-7a and 3’-UTR of AKT2. (B) Relative luciferase activities of AKT2 wild type (WT) and mutant (Mut) 3’- UTR were assayed and normalized to those of renilla activities (internal control). Data were presented as means±SE from three independent experiments with triple replicates per experiment. (C) TPC-1 cells stably expressing scrambled control (miR-NC) and let-7a were subjected to qRT-PCR analysis for AKT2 and GAPDH expression levels. (D) Total proteins were subjected to western blotting and detected for AKT2 expression levels. The density of AKT2 expression levels were quantified and normalized to the level of GAPDH. (E) Spearman’s correlation analysis was used to determine the correlation between the expression levels of AKT2 and let-7a (Spearman’s correlation analysis, r=-0.4516; p<0.05).

