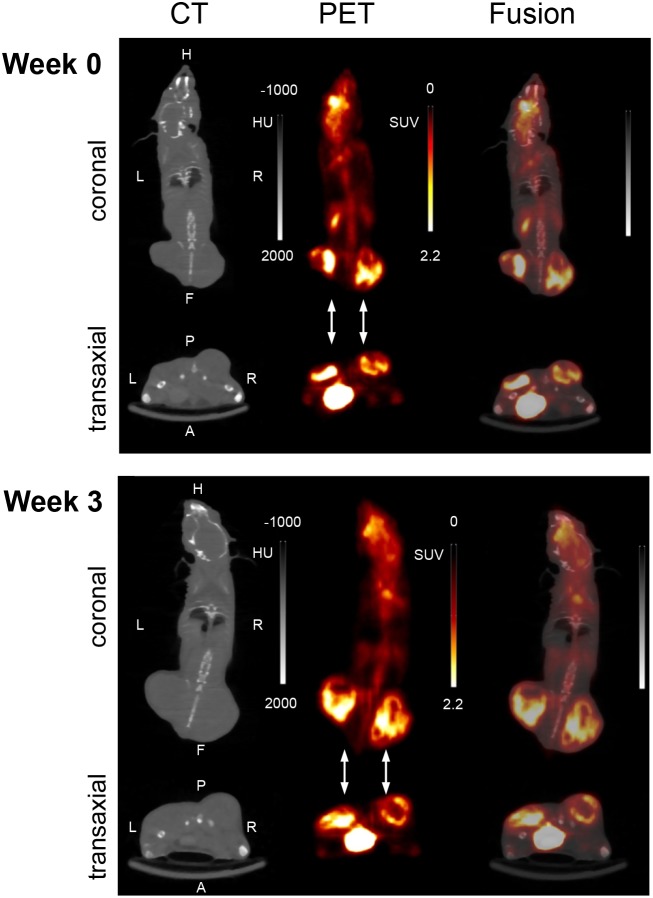
Figure 2. Representative PET/CT images (summed images; coronal and transaxial slices) at two experimental time points (week 0, week 3).
The images were derived from the same mouse as in Figure 1: A 15 min imaging scan was performed 60 min after intravenous injection of 18F-FDG. The flank tumors are pointed out by arrows. HU; Hounsfield units; SUV; standardized uptake value.

