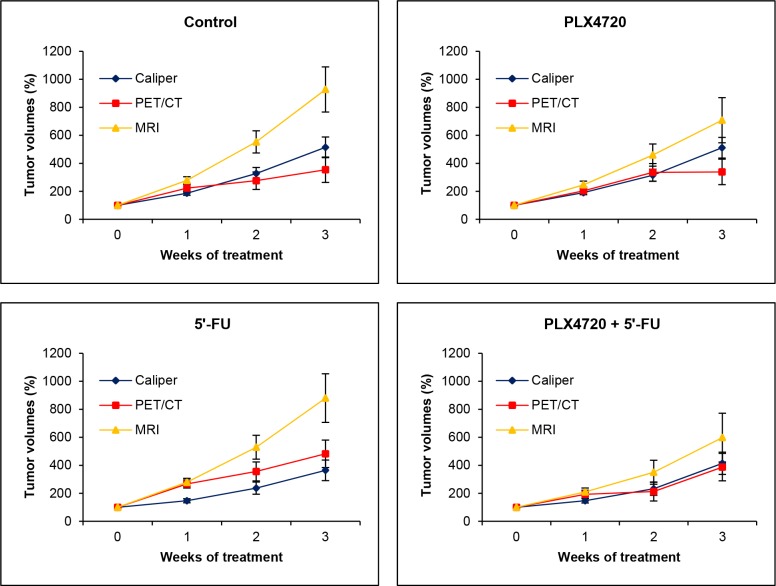
Figure 6. Comparison of volumetric data obtained by caliper, MRI and PET/CT.
The data presented in Figure 5 were used to calculate (by GLM-RP model) estimated marginal means ± SEM of anatomic and metabolic volumes over time for each of the four experimental groups. A value of one hundred percent corresponds to tumor volumes prior to treatment (week 0).

