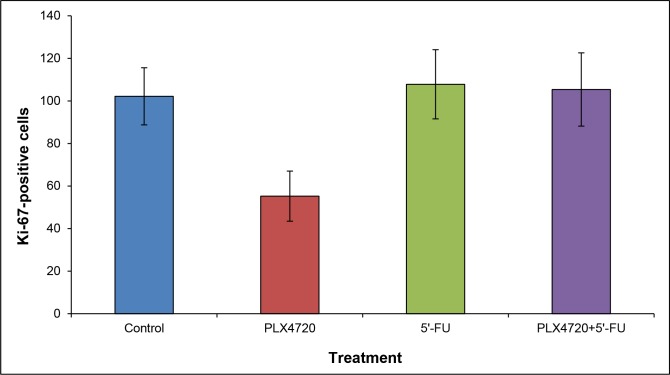
Figure 9. Quantification of Ki-67-positive cells.
Staining and cell counting were performed as described in the “materials and methods” section. Data are presented as numbers of Ki-67-positive cells out of 300 tumor cells (mean ± SEM; n = 15-17 samples). There were no statistically significant differences between the experimental groups.

