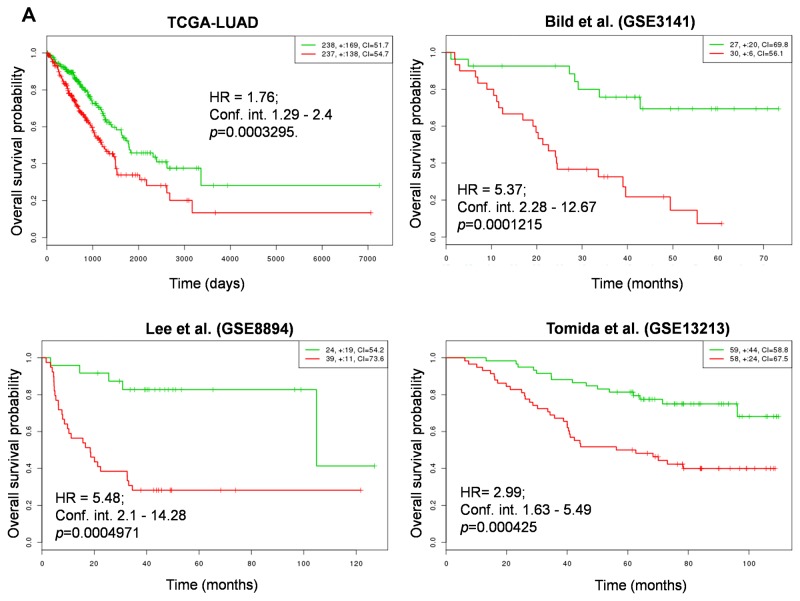
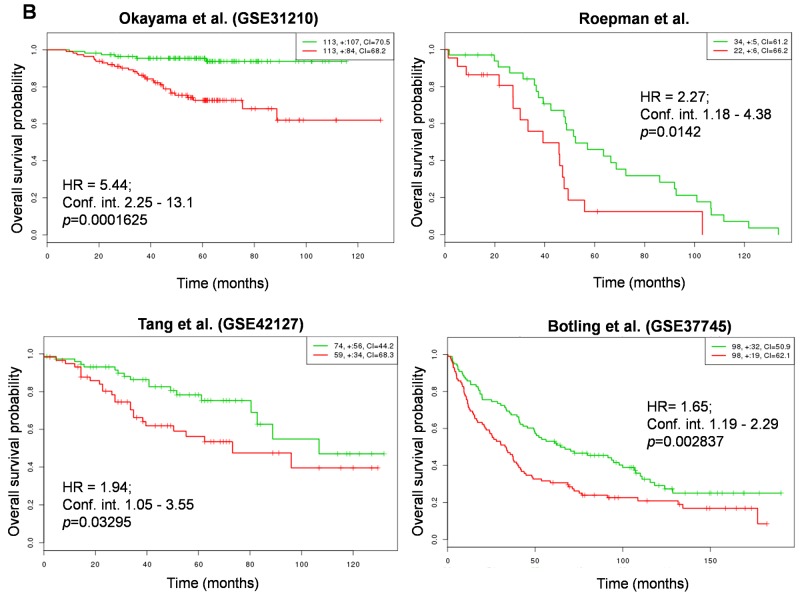
Figure 7. Correlation of NRMGS expression levels and survival in lung cancer patients.
(A, B) Kaplan-Meier survival plots showing that high NRMGS expression is associated with poor survival in 8 independent lung cancer cohorts. Red, high-risk NRMGS curves; green, low-risk NRMGS curves. Insets (upper right), numbers of high- and low-risk samples, number of censored samples marked with +, and concordance index (CI) of each risk group. The X-axis represents time (days or months). The Y-axis shows overall survival probability (HR, hazard ratio; Conf. int., confidence interval).


