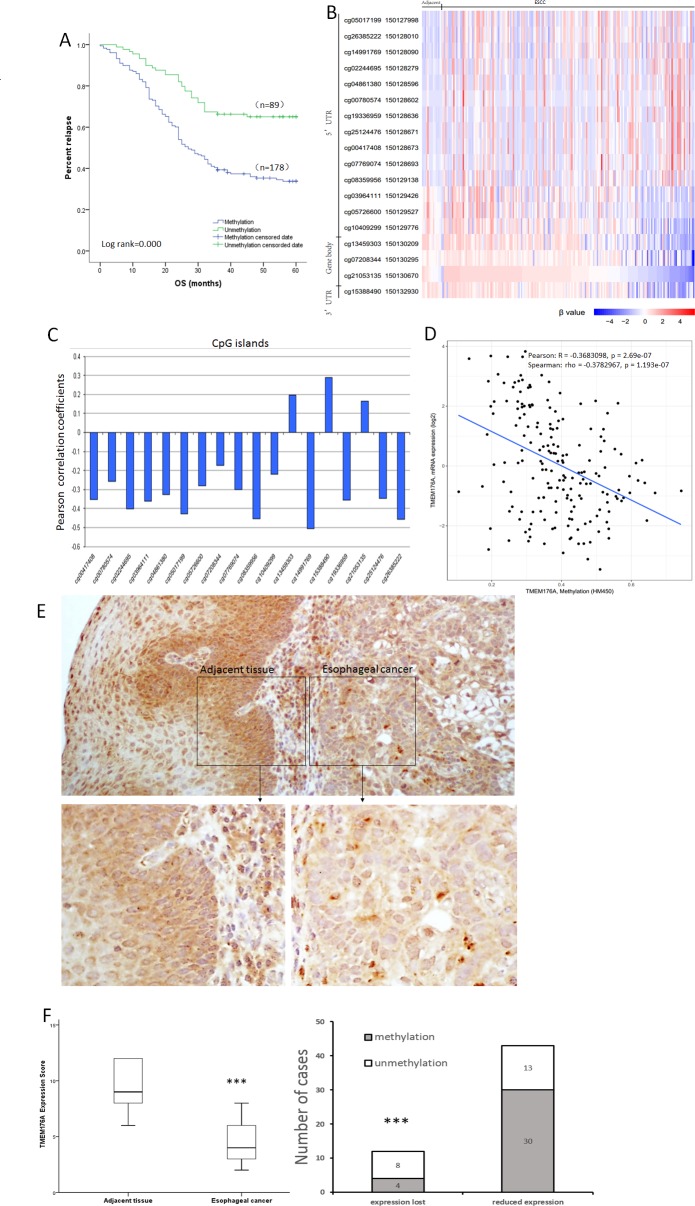
Figure 2. Methylation status and expression of TMEM176A in primary esophageal cancer samples.
(A) TMEM176A methylation is associated with poor 5-years OS. OS: Overall survival. (B) Heatmap of methylation of 18 CpG sites in the promoter region of TMEM176A gene. (C) Correlation of methylation of each CpG site and expression of TMEM176A. (D) Scatter-plot: The methylation status of 18 CpG sites in the promoter region is correlated to loss off/reduced TMEM176A expression in 184 cases of esophageal cancers (Pearson: R = -0.3683098, p = 0.000 Spearman: rho = -0.3782967, p = 0.000). (E) Representative IHC results showing TMEM176A expression in esophageal cancer and matched adjacent tissue samples (upper: ×100; lower: ×400). (F) TMEM176A expression scores are shown as box plots, horizontal lines represent the median score; the bottom and top of the boxes represent the 25th and 75th percentiles, respectively; vertical bars represent the range of data. The expression levels of TMEM176A were significantly different between adjacent tissue and esophageal cancer samples. ***p< 0.01.

