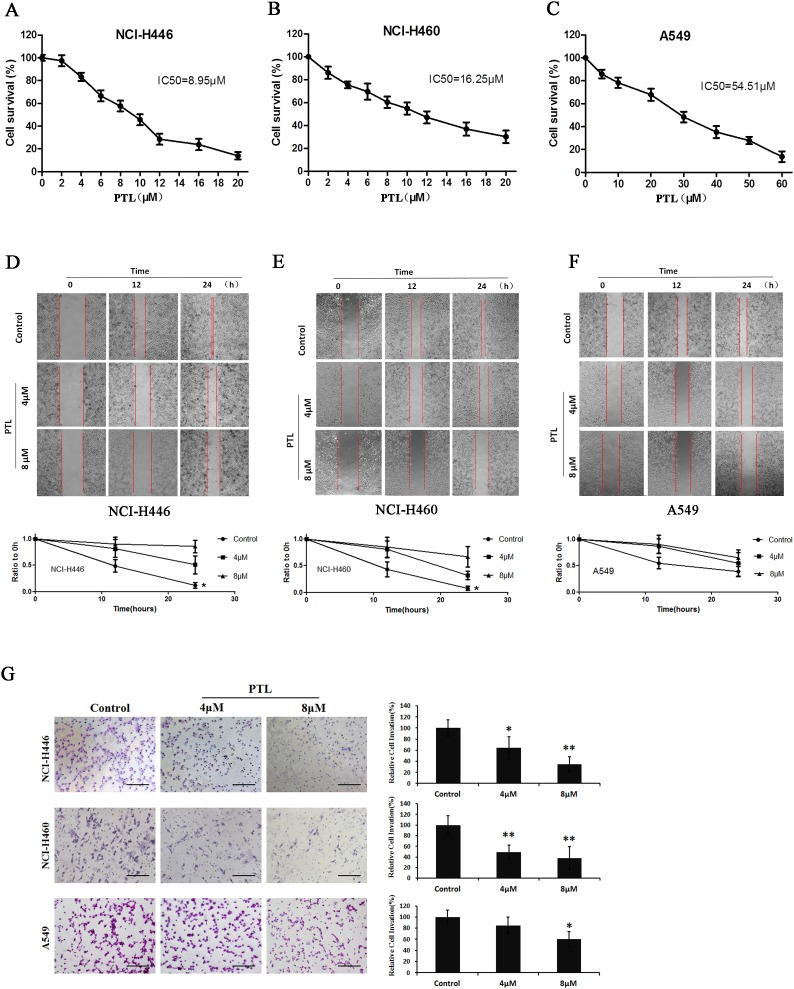
Figure 1. Effects of PTL on cell viability and migration.
(A) Survival of NCI-H446 cells treated with the indicated amounts of PTL for 48 h; IC50 = 8.95 µM. (B) Survival of NCI-H460 cells treated with the indicated amounts of PTL for 48 h; IC50 =16.25 µM. (C) Survival of A549 cells treated with the indicated amounts of PTL for 48 h; IC50 = 54.51 µM. (D–F) Cells were re-incubated in the medium containing 0, 4, and 8 µM PTL for 24 h. Results showed PTL inhibiting the NCI-H446 (Figure 1D), NCI-H460 (Figure 1E), and A549 (Figure 1F) cells. (G) Transwell chambers were utilized for the invasion assay, and images were obtained at 200× magnification. NCI-H446, NCI-H460, and A549 cells were treated with0, 4, and 8 µM PTL for 24 h. Each experiment was performed in triplicate. Results are the means of the three experiments, and the error bars represent standard deviation (*P ≤ 0.05, **P≤ 0.01).

