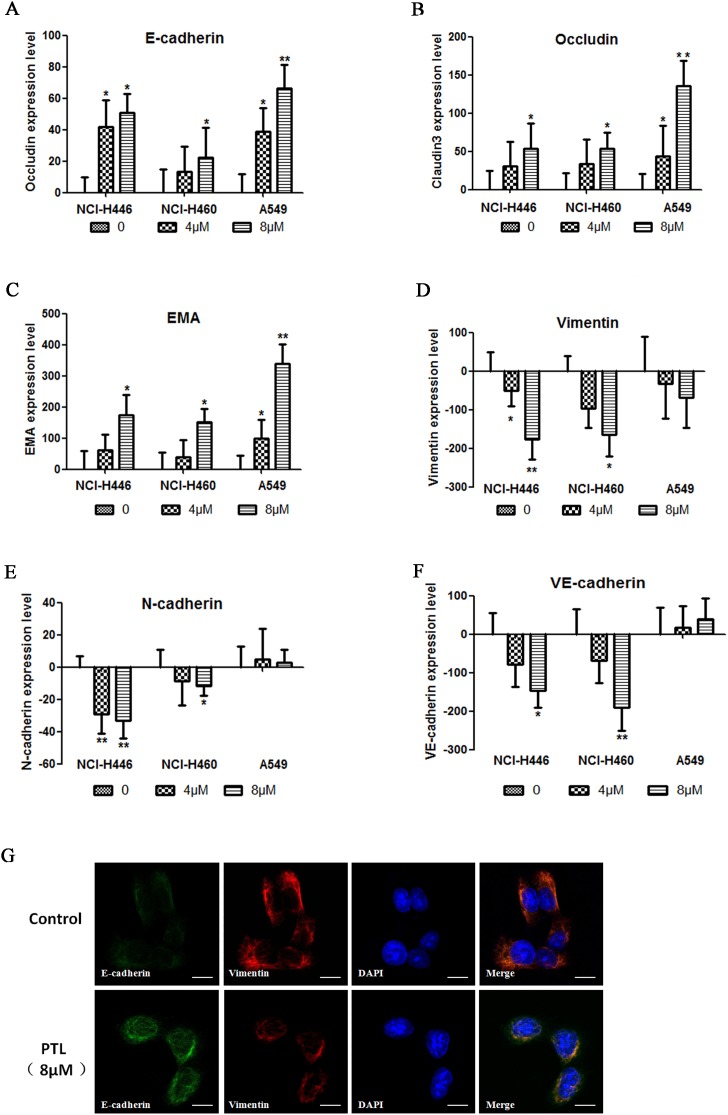
Figure 3. changes in EMT PTL reverses biomarkers.
(A–C) E-cadherin, Occludin, and EMA expression levels increased in a dose-dependent manner following PTL treatment. (D–F) In NCI-H446 and NCI-H460 cells, Vimentin, N-cadherin, and VE-cadherin expression levels decreased in a dose-dependent manner, whereas in A549, no significant change was found in these biomarkers following PTL treatment. (G) Typical images of immunofluorescent double staining for E-cadherin and Vimentin in NCI-H446 cells. Each experiment was performed in triplicate. The results are shown as the means of the three experiments, and the error bars represent the standard deviation (*P ≤ 0.05, **P≤ 0.01).

