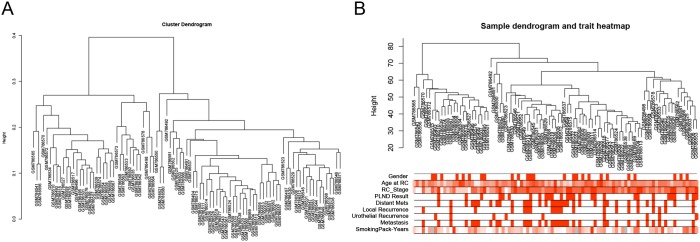
Figure 1. Samples clustering to detect outliers (GSE31684).
(A) Cluster dendrogram. (B) Sample dendrogram and trait indicator. The clustering was based on the expression data of differentially expressed genes between low grade and high grade tumor samples in BCa. The color intensity was proportional to age at RC, RC stage and smoking pack-years. (RC: radical cystectomy).

