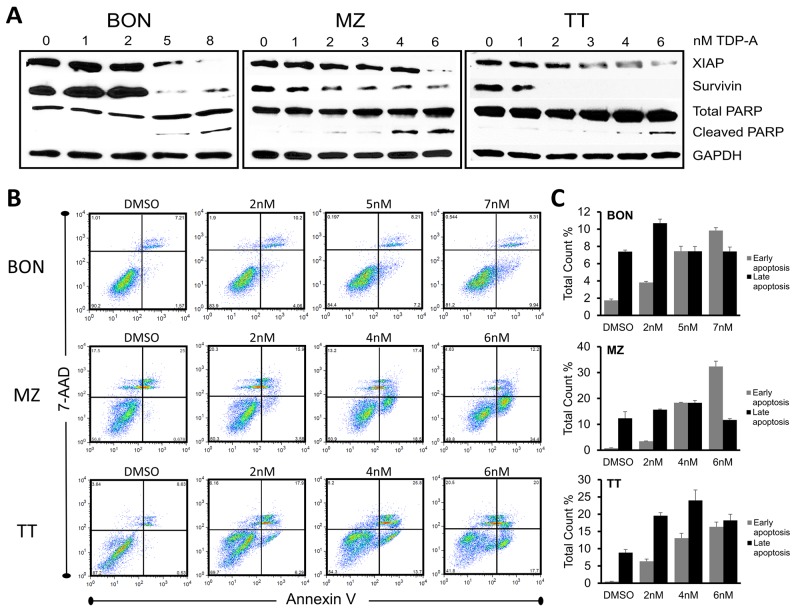
Figure 4. TDP-A induces apoptosis in NE cancer cells.
(A) Detection of apoptotic markers including XIAP, survivin, and total/cleaved PARP by Western blot in NE cancer cells after TDP-A treatment for 48 hrs at 5-6 concentrations around their IC50. DMSO vehicle control was used as negative control. GAPDH was used for loading control. (B) NE cancer cells were exposed to multiple concentrations of TDP-A or to vehicle control (DMSO) for 48 h before they were double stained with Annexin V and 7-AAD for flow cytometry analysis. Percentage at right upper quadrant denote the cells in late apoptotic phase and right lower quadrant denotes early apoptotic phase. The figure shows one representative experiment. Data from three repeated experiments are summarized in bar graphs (C), and shown as mean percentage of total count ± SEM.

