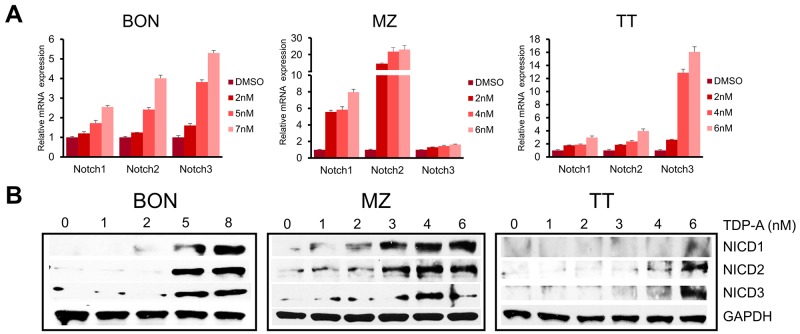
Figure 6. TDP-A induces Notch isoforms in NE cancer cells.
(A) TDP-A treatment resulted in significant dose dependent increase in Notch isoforms (Notch1, 2 and 3) at the mRNA level in NE cancer cells assessed by real-time RT-PCR. Data were plotted relative to cell treated with vehicle control (DMSO). All values are expressed as mean ± SEM. (B) Notch intracellular domain (NICD) 1-3 were detected by Western blot treated with different concentrations of TDP-A or vehicle control (DMSO). GAPDH was used as loading control.

