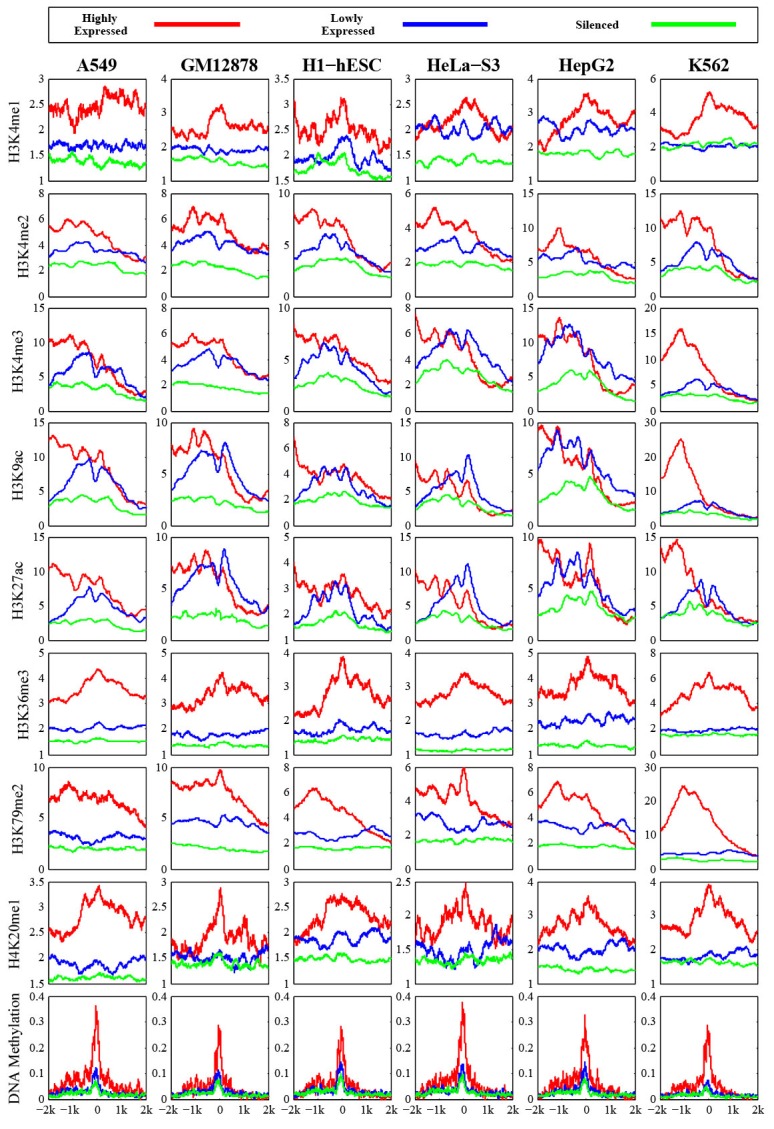
Figure 2. Profiles of chromatin features along pre-miRNA genomic sequences in human embryonic stem cell.

The y axis represents the average values of chromatin feature coverage, and the x axis represents the distance relative to the center of pre-miRNA.
