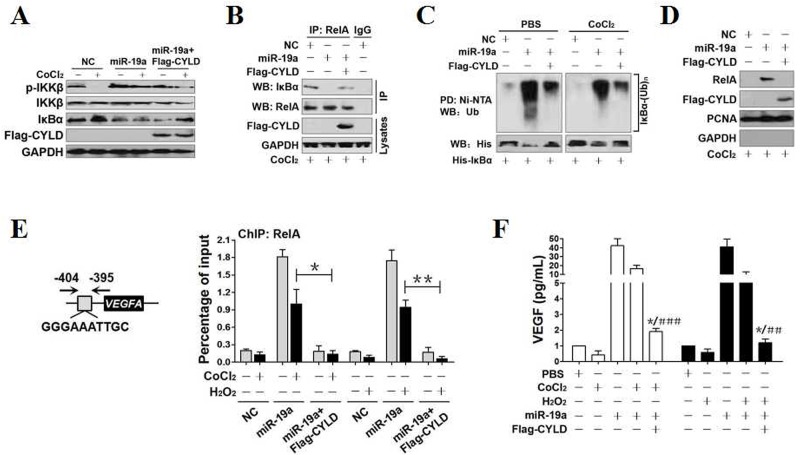
Figure 3. CYLD repression contributes to NF-κB transactivation during OS in a miR-19a-dependent manner.
(A) Western-blotting analyses comparing the levels of IKKβ phosphorylation and total IκBα expression in PC12 cells treated with 0.6 mmol/L CoCl2 in the presence of miR-19a mimics transfection and miR-19a mimics plus Flag-tagged wild-type CYLD cotransfection, respectively. (B) Coimmunoprecipitation assays examining the interaction between RelA and IκBα in PC12 cells treated with 0.6 mmol/L CoCl2 in the presence of miR-19a mimics transfection and miR-19a mimics plus Flag-tagged wild-type CYLD cotransfection, respectively. IP, immunoprecipitation; WB, western-blotting. (C) Cellular ubiquitination assays comparing the poly-Ub levels of IκBα in PC12 cells treated with 0.6 mmol/L CoCl2 in the presence of miR-19a mimics transfection and miR-19a mimics plus Flag-tagged wild-type CYLD cotransfection, respectively. PD, pull-down. (D) Western-blotting analyses detecting the levels of nuclear RelA accumulation in PC12 cells treated with 0.6 mmol/L CoCl2 in the presence of miR-19a mimics transfection and miR-19a mimics plus Flag-tagged wild-type CYLD cotransfection, respectively. (E) ChIP analysis for RelA binding to VEGFA gene promoter in PC12 cells exposed to 0.6 mmol/L CoCl2 and 0.4 mmol/L H2O2 in the presence of miR-19a mimics transfection and miR-19a mimics plus Flag-tagged wild-type CYLD cotransfection, respectively. Enrichment of promoter region was normalized by input and data are expressed as mean ± s.d. of at least three experiments. *p < 0.05; **p < 0.01, one-way ANOVA, post hoc comparisons, Tukey’s test. (F) ELISA assay for VEGF release from PC12 cell cultures exposed to 0.6 mmol/L CoCl2 and 0.4 mmol/L H2O2 in the presence of miR-19a mimics transfection and miR-19a mimics plus Flag-tagged wild-type CYLD cotransfection, respectively. Enrichment of promoter region was normalized by input and data are expressed as mean ± s.d. of at least three experiments. *p < 0.05 versus PBS; ***p < 0.001 versus CoCl2 or H2O2 plus miR-19a, one-way ANOVA, post hoc comparisons, Tukey’s test.

