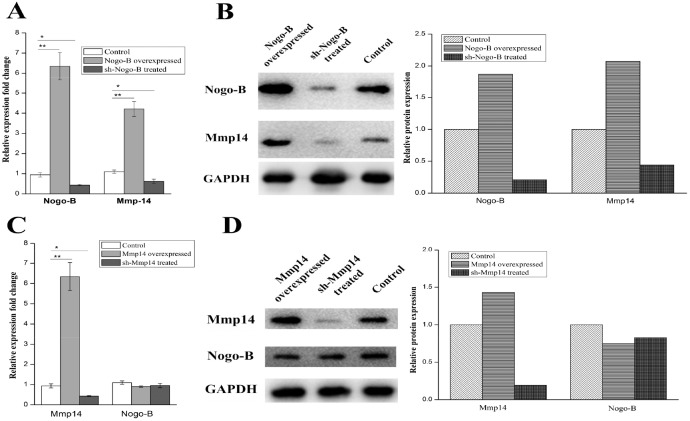
Figure 6. The protein and mRNA expression of the Mmp14 were in line with the up and down regulated Nogo-B in A549 cells.
(A) qRT-PCR analysis of Mmp14 and Nogo-B levels in the A549 cells with indicated treatments. All data are expressed as the means±SD of at least three independent experiments. The protein and mRNA expression of the Mmp14 were influenced by the up and down regulated Nogo-b in A549 cells. (B) Western blot analysis of Mmp14 in A549 cells treated with overexpresion and silence of Nogo-B, GAPDH was used as a loading control. (C) qRT-PCR analysis of Mmp14 and Nogo-B levels in the A549 cells with indicated treatments. All data are expressed as the means±SD of at least three independent experiments. (D) Western blot analysis of Nogo-B in A549 cells treated with overexpresion and silence of Mmp14, GAPDH was used as a loading control.

