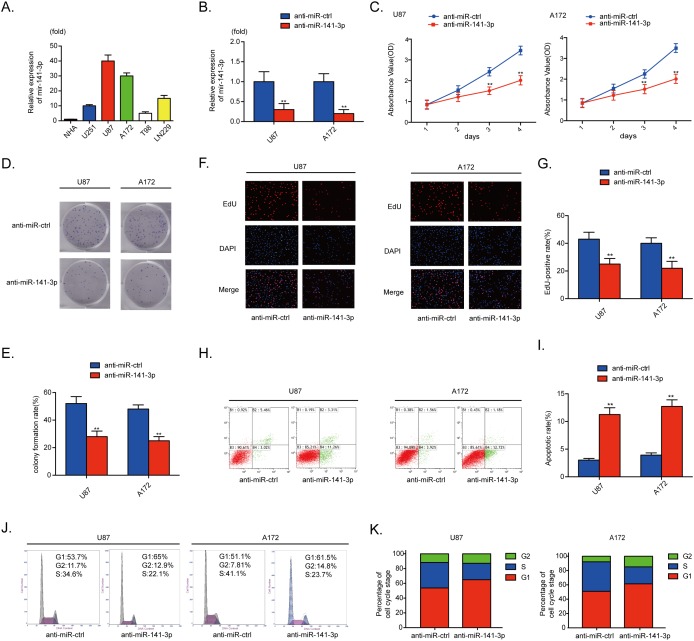
Figure 2. MiR-141-3p promotes glioma growth.
(A) Relative expressions of miR-141-3p in glioma cell lines A172, U87, U251, T98, and Ln229 and normal human astrocytes. (B) Relative expression of miR-141-3p in U87 and A172 cells was analyzed by qRT-PCR after transfection. (C) Cell proliferation was detected by CCK8 assays in U87 and A172 cells transfected with anti-miR-ctrl or anti-miR-141-3p. (D and E) Colony formation assays in U87 and A172 cells transfected with anti-miR-ctrl or anti-miR-141-3p. Scale bar: 500 μm. (F and G) Respective merged images of U87 and A172 cells in EDU transfected with anti-miR-ctrl or anti-miR-141-3p after 48 h. Representative images are shown (original magnification, 200×). (H and I) Apoptosis rates of U87 and A172 cells transfected with anti-miR-ctrl or anti-miR-141-3p after 48 h were detected by flow cytometry. All experiments were performed three times using triplicate samples. Average values are indicated with error bars in the histogram. (J and K) The cell cycle of U87 and A172 cells transfected with anti-miR-ctrl or anti-miR-141-3p after 48 h was detected by flow cytometry. All experiments were performed three times using triplicate samples. Average values are indicated with error bars in the histogram. Results are presented as the mean ± S.D. *P<0.05, **P<0.01, and ***P<0.001.

