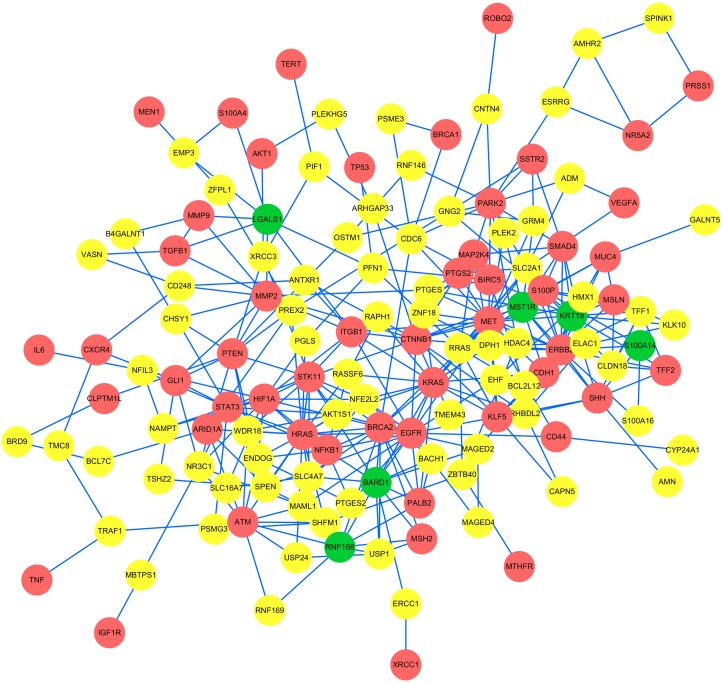
Figure 2. The subnetwork extracted by limited k-walks algorithm.
The network extracted by edge-weighted limited k-walk algorithm was illustrated. It contained 341 edges and 134 nodes. Red nodes represent 52 seed genes, green nodes represent 6 identified candidate genes and yellow nodes represent the other 76 linker genes except for the 6 candidates.

