Fig. 6.
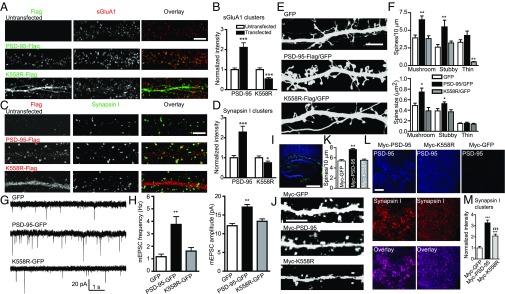
K63-polyUb facilitates synapse maturation and strengthening. (A) sGluA1 clusters (red) from untransfected neurons or neurons transfected with PSD-95–Flag or K558R-Flag (green). (Scale bar, 5 μm.) (B) Quantification of sGluA1 cluster intensity, normalized to untransfected neurons. n = 28–29 cells; ***P < 0.001. (C) Synapsin I clusters (green) from untransfected and PSD-95–Flag or K558R-Flag transfected (red) neurons. (Scale bar, 5 μm.) (D) Quantification of synapsin I cluster intensity, normalized to untransfected neurons. n = 14–26 cells; ***P < 0.001, *P < 0.05. (E) GFP images of dendrites and spines from neurons (co)transfected with the indicated plasmids. (Scale bar, 5 µm.) (F) Quantification of spine density (Upper) and size (Lower) in E. n = 7–12 cells. **P < 0.01, *P < 0.05. (G) Representative mEPSCs from neurons transfected with indicated plasmids. (H) Mean mEPSC frequency (Left) and amplitude (Right). n = 27–38 cells. **P < 0.01. (I) Lentivirus expression of Myc–PSD-95 or Myc-K558R in the hippocampus in vivo. Viruses expressing Myc–PSD-95, Myc-K558R, or Myc-GFP and GFP within the same dual promoter vector (Fig. S7C) were injected into P20 PSD-95–KO brains. Nuclei are stained with Hoechst (blue). (Scale bar, 500 µm.) (J) Examples of apical dendrites (GFP) of infected pyramidal neurons. (Scale bar, 5 µm.) (K) Quantification of spine density in J. n = 28–31 cells. **P < 0.01. (L) Example PSD-95 and synapsin I puncta in infected striatum radiatum. (Scale bar, 5 μm.) (M) Quantification of synapsin I cluster intensity in L. n = 16–18 cells. ***P < 0.001 vs. Myc-GFP; ###P < 0.001 vs. Myc–PSD-95; unpaired t tests in B and D, one-way ANOVA with Dunnett’s’ test vs. GFP in F, H, and K, and one-way ANOVA with Tukey’s test in M.

