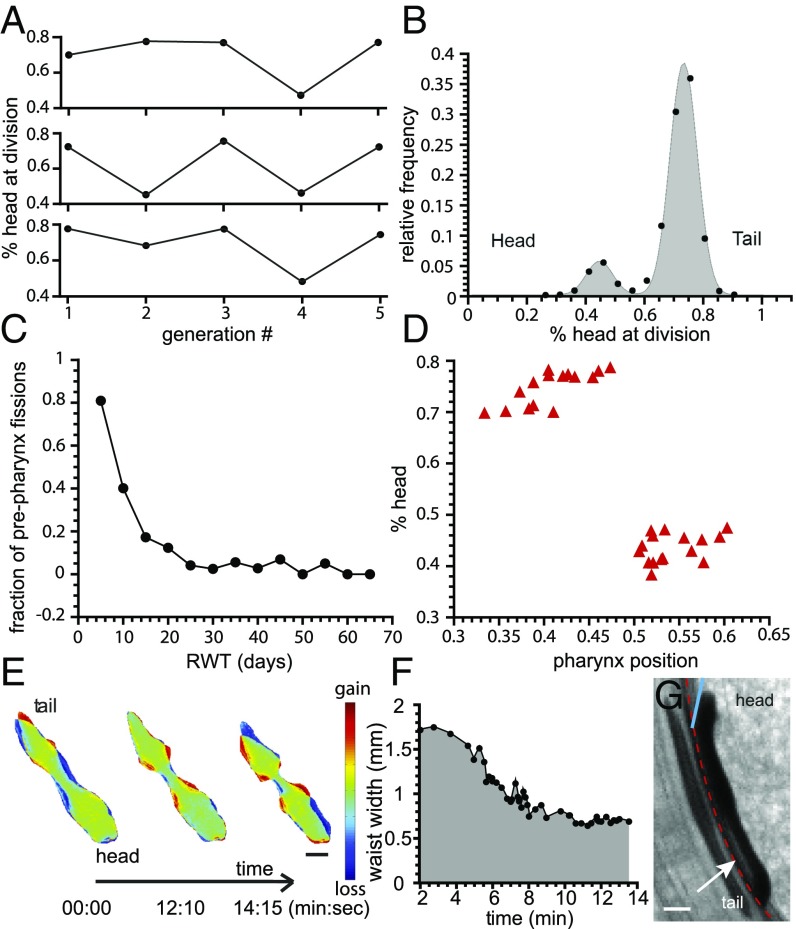
Fig. 2.
Waist formation. (A) The waist position along the head–tail axis is not conserved across generations for a single planarian line. (B) Frequency of occurrence of waist position, expressed as percentage head at division (n = 1,335). (C) Quantification of the fraction of prepharynx fissions as a function of RWT. (D) Quantification of percentage head at division as a function of relative pharynx position shows that the latter predicts fission position. (E) Color-coded maps of worm footprint, showing a representative sequence of waist formation in an amputated planarian. Colors indicate the change in the mass per unit area, with green corresponding to no change, blue to loss, and red to gain of mass. (Scale bar: 1 mm.) (F) The width of the waist region versus time in E. (G) Side view image of a planarian undergoing fission. The dashed red line outlines the Petri dish wall. The white arrow highlights a gap between the waist of the worm and the substrate. The blue line indicates the angle by which the planarian lifts its head before pulsation. (Scale bar: 1 mm.)

