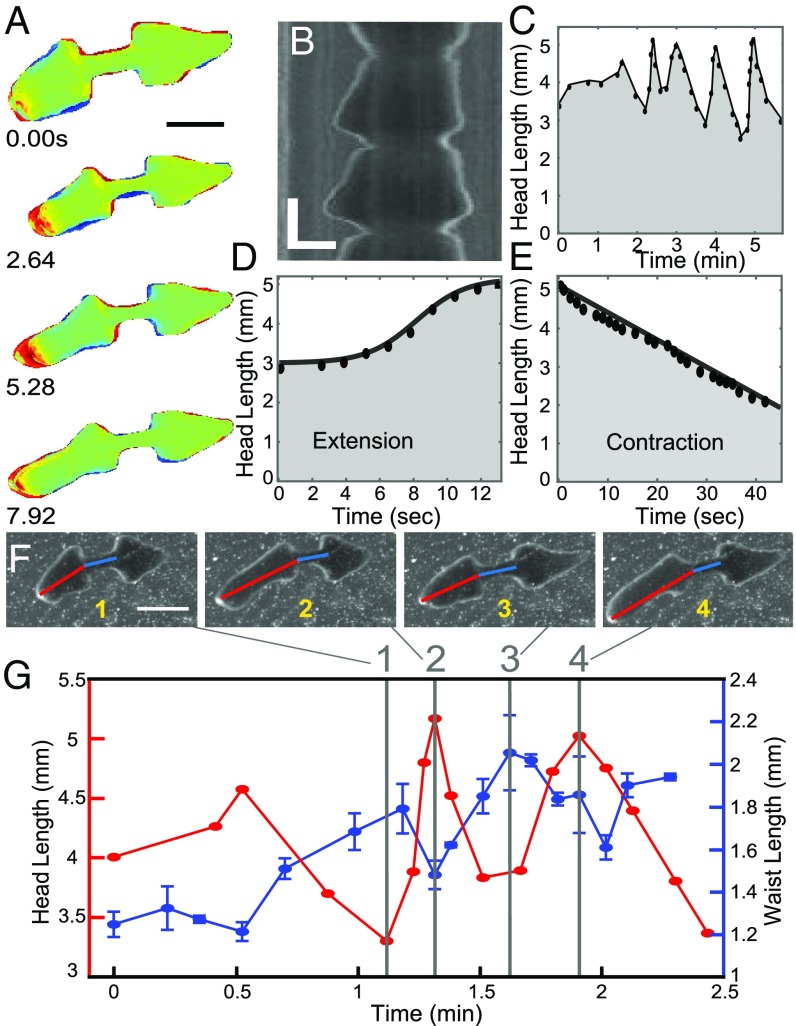
Fig. 3.
Pulsation. (A) Representative sequence of head pulsation of an amputated planarian. Color coding is the same as in Fig. 2. (Scale bar: 3 mm.) (B) Kymograph showing multiple head pulses. (Vertical scale bar: 20 s; horizontal scale bar: 1 mm.) (C). Head length as a function of time during a series of head pulsations. (D) Head extension is logistic and fast, whereas (E) head contraction is linear and slow. (F and G) Head and waist lengths are anticorrelated. (F) Consecutive images of a planarian with its head and waist lengths shown by red and blue lines, respectively. (Scale bar: 3 mm.) (G) Time dependences of head length and waist length of the planarian from the images in F.

