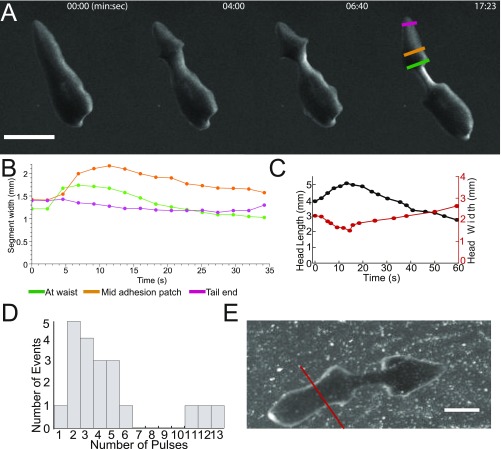
Fig. S3.
Waist formation and pulsations. (A) Representative sequence of waist formation. (Scale bar: 3 mm.) (B) Material transfer out of the waist into the tail adhesion patch. Colors correspond to colors in A. (C) Head length and head width as a function of time for a single fission event. Due to conservation of volume, head width and head length are anticorrelated. (D) Distribution of number of pulses per fission event. (E) The kymographs of pulsation (Fig. 3B in the main text) was computed along the red line shown here. (Scale bar: 2 mm.)

