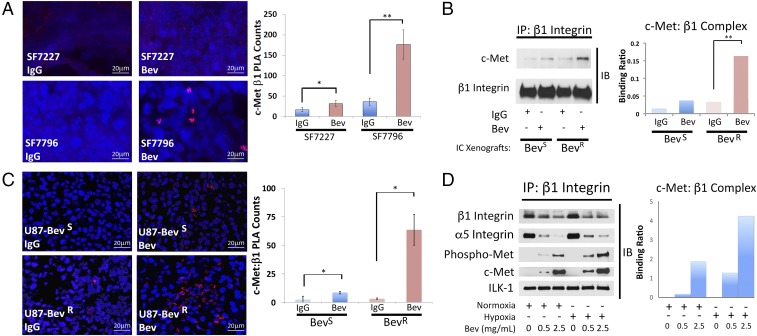
Fig. 3.
A c-Met/β1 complex forms in tumors that have evolved resistance to antiangiogenic therapy. (A) PLAs of GBM PDXs revealed more c-Met/β1 complex with bevacizumab treatment of resistant PDX SF7796 (P = 0.003), with a lesser increase occurring with bevacizumab treatment of intracranial responsive PDXs (SF7227) (P = 0.02). IP (B) and PLA (C) of U87-BevS and U87-BevR intracranial xenografts treated with IgG or bevacizumab revealed increased c-Met/β1 complex with bevacizumab treatment, particularly in resistant xenografts (P = 0.003 U87-BevR IP; P = 0.02 PLA for U87-BevS and U87-BevR). (D) U87 cells were cultured with increasing bevacizumab concentrations in normoxia and hypoxia for 48 h (Upper row). Cell lysates were immunoprecipitated with β1 and blotted for total and phosphorylated c-Met to assess their binding to β1 (Left). The ratio of c-Met binding to immunoprecipitated β1 based on band intensities is in the graph. *P < 0.05; **P < 0.01.

