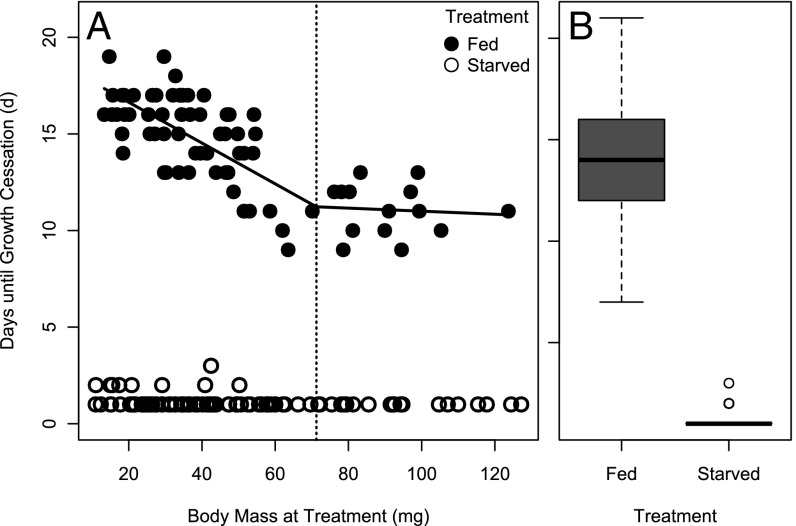
Fig. 1.
Days until growth cessation for larvae that were provided an excess of food provisions (Fed) or that had food provisions removed (Starved). (A) The relationship between days until growth cessation and larval mass. For the fed treatment, a bisegmented regression (lines) was performed to test for a switch in the response to excess feeding along larval growth. (B) Distribution of days until growth cessation relative to treatment.

