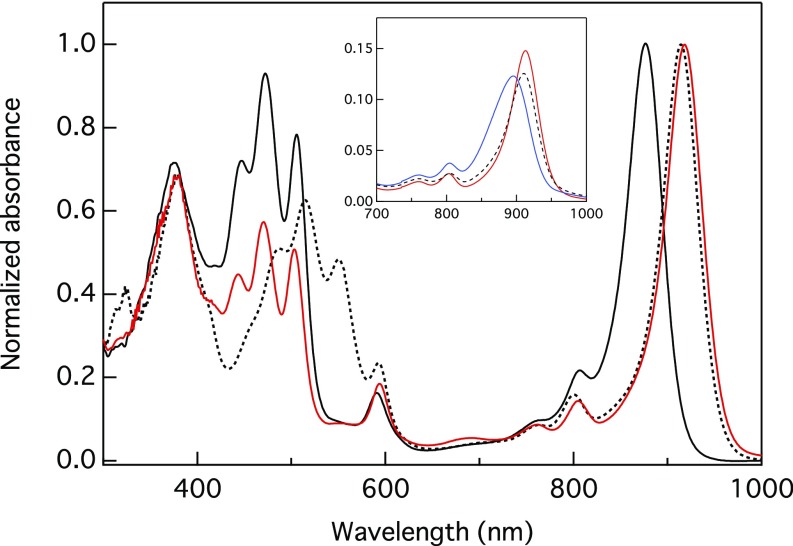
Fig. 2.
Comparison of the absorption spectrum of the chimeric LH1-RC complex purified from strain TS2 (red curve) with the spectra of the LH1-RC complexes purified from strain DP2 (black curve) and from Tch. tepidum (dotted curve). All spectra were normalized at LH1-Qy bands. (Inset) Changes in the absorption spectra of the TS2 LH1-RC (red) on addition of EDTA to a final concentration of 5 mM (blue curve), followed by addition of CaCl2 to a final concentration of 175 mM (dashed curve).

