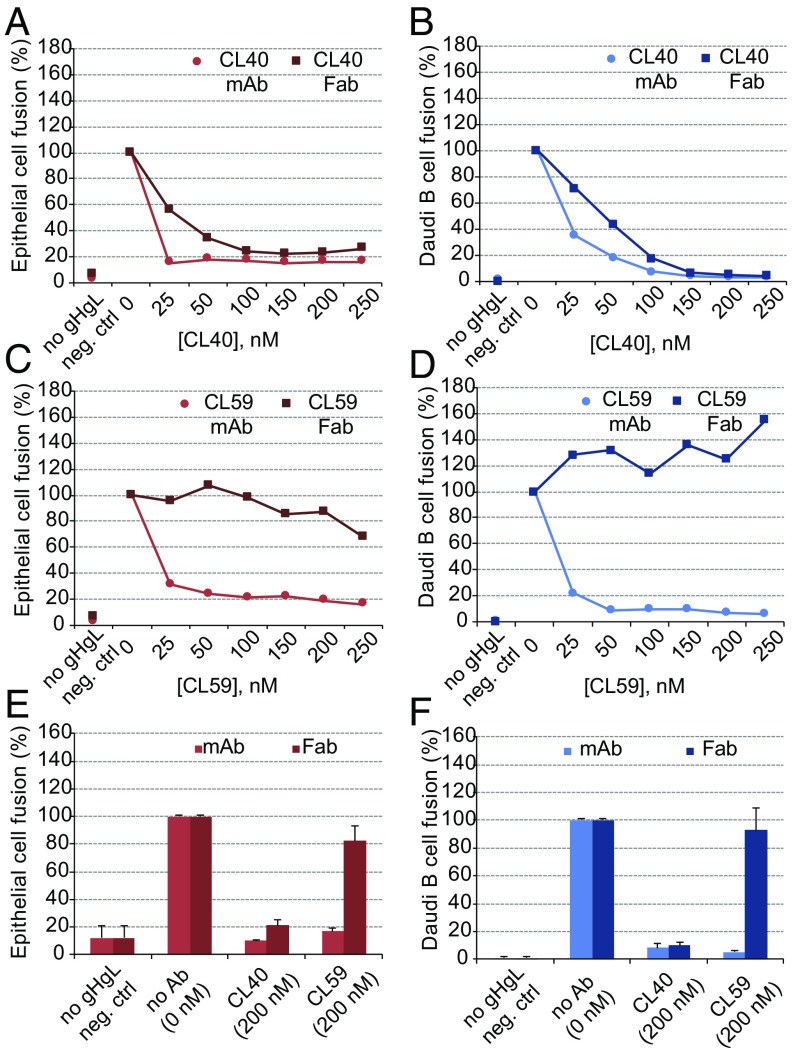
Fig. 1.
CL40 and CL59 inhibition of membrane fusion. (A and B) Inhibition of fusion activity with purified CL40 mAb (lighter color shade) and Fab (darker color shade) using epithelial cells (A) and B cells (B). (C and D) Inhibition of fusion activity with purified CL59 mAb (lighter color shade) and Fab (darker color shade) using epithelial cells (C) and B cells (D). For these panels, the x-axis indicates the amount of purified antibody as final concentration in nanomoles. Empty pSG5 plasmid with no gH or gL insert serves as the negative control, and fusion activity with no antibody is set to 100% for HEK 293 epithelial cells (maroon) and Daudi B cells (blue). Each data point is represented by a single experiment titrating the antibody (except negative control). (E and F) Fusion activity expressed as the average from three independent experiments (biological replicates) with a 200 nM final antibody concentration, with fusion activity expressed as percentage with WT and no antibody data point set at 100% for HEK 293 epithelial cells (E) and Daudi B cells (F). In each experiment, the negative control is pSG5 plasmid with no gH or gL insert.

