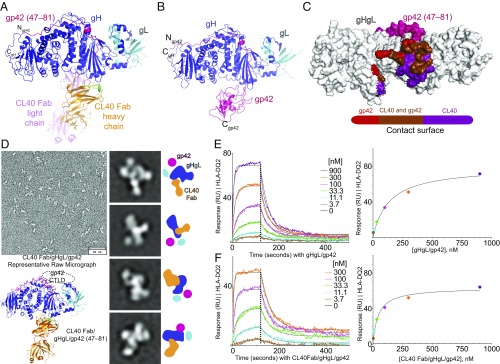
Fig. 4.
CL40 binds a gH epitope that overlaps with the gp42 C-domain contact site. (A and B) Cartoon representations of the crystal structure of CL40Fab/gHgL/gp42(47–81) (A) and gHgL/gp42 complex (from PDB ID code 5T1D) (B) showing that the CL40 Fab binds to the same site on gH as the gp42 C-domain (CTLD). (C) The CL40 and gp42 C-domain CTLDs show substantial overlap in their respective surface contacts on gH. (D) Negative-stain EM of CL40Fab/gHgL/gp42 with a representative raw micrograph and selected 2D class averages showing the identity of all glycoproteins in the complex. All 250 2D class averages are shown in Fig. S5A. For each set of 2D class average showing a different view, a cartoon schematic at the side illustrates the identities of all component glycoproteins by their unique shape and size characteristics. The crystal structure of CL40 Fab/gHgL/gp42(47–81) is also shown for comparison. A dashed oval depicts the space occupied by the gp42 C-domain. The exaggerated movement of the gp42 C-domain perceived here could have resulted from flattening on the EM grid, while the actual displacement of gp42 C-domain could be small. (Scale bars: Top Left, 40 nm; Middle, 19 × 19 nm.) (E and F) CL40 Fab binding to gHgL/gp42 complexes does not interfere with the binding of HLA-DQ2. HLA-DQ2 (α1 gliadin) was immobilized on a CMD 200m biosensor chip using amine-coupling chemistry. Association and dissociation kinetics for a gHgL/gp42 preformed complex (E) and a CL40/gHgL/gp42 preformed complex (F) are shown with a 1:1 global fit model overlaid on data and shown as dashed curve (Left) and a steady-state analysis binding curve plotting analyte concentration (nM) versus response (RU) (Right). The KD values from the two analyses are comparable with each other, as shown in Tables 1 and 2. In addition, the KD value for binding of the preformed gHgL/gp42 to immobilized HLA-DQ2 obtained here and shown in Table 1 is comparable to the value obtained by the BLI method using Octet RED96 reported previously (10).

