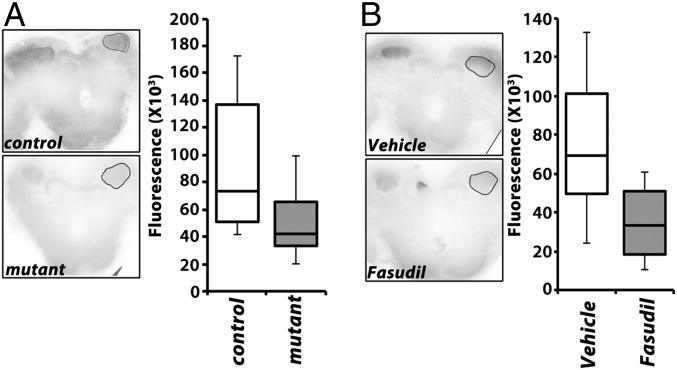
Fig. 6.
Decreased filamentous actin in the MBs of drk mutants and upon acute pharmacological inhibition of Drok. (A) Representative confocal images of whole-mount brains at the level of the calyces used to quantify fluorescence from the marked regions of interest (ROI) after rhodamine-conjugated phalloidin staining. Control indicates LeoGal4/+, while mutant indicates the genotype drkΔP24/LeoGal4; drkR-1.2/+. Quantification (Right) of multiple experiments revealed significant differences in fluorescence in the calyces control and mutant animals (Wilkoxon test, χ2 = 12.4910, P < 0.0004, n > 20). (B) Representative confocal images of whole-mount brains at the level of the calyces used to quantify fluorescence from the marked ROIs after rhodamine-conjugated phalloidin staining of vehicle and Fasudil-treated w1118 animals. Quantification (Right) revealed significant differences in fluorescence in the calyces control and mutant animals (Wilkoxon test, χ2 = 22.6722, P < 0.0001, n > 28).

