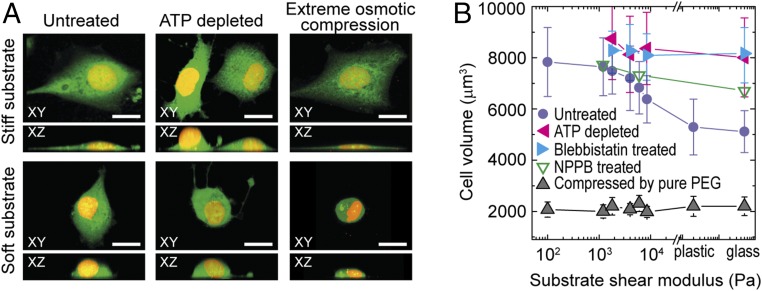
Fig. 4.
Cell morphology and volume under drug treatment and osmotic compression. (A) The 3D morphology of control cells and cells with ATP depletion and under extreme osmotic compression, on stiff and soft substrates. Cytoplasm (green) and nucleus (yellow) are labeled. (Scale bars: 20 μm.) (B) Cells without active contraction (blebbistatin-treated and ATP-depleted) and under extreme osmotic compression do not exhibit a volume dependence with substrate stiffness; cells with choloride channels-inhibited (NPPB treated) exhibit a weaker volume dependence with substrate stiffness. The control data of A7 cells is same as in Fig. 2C. Error bars represent the SD (n > 200 individual cells).

