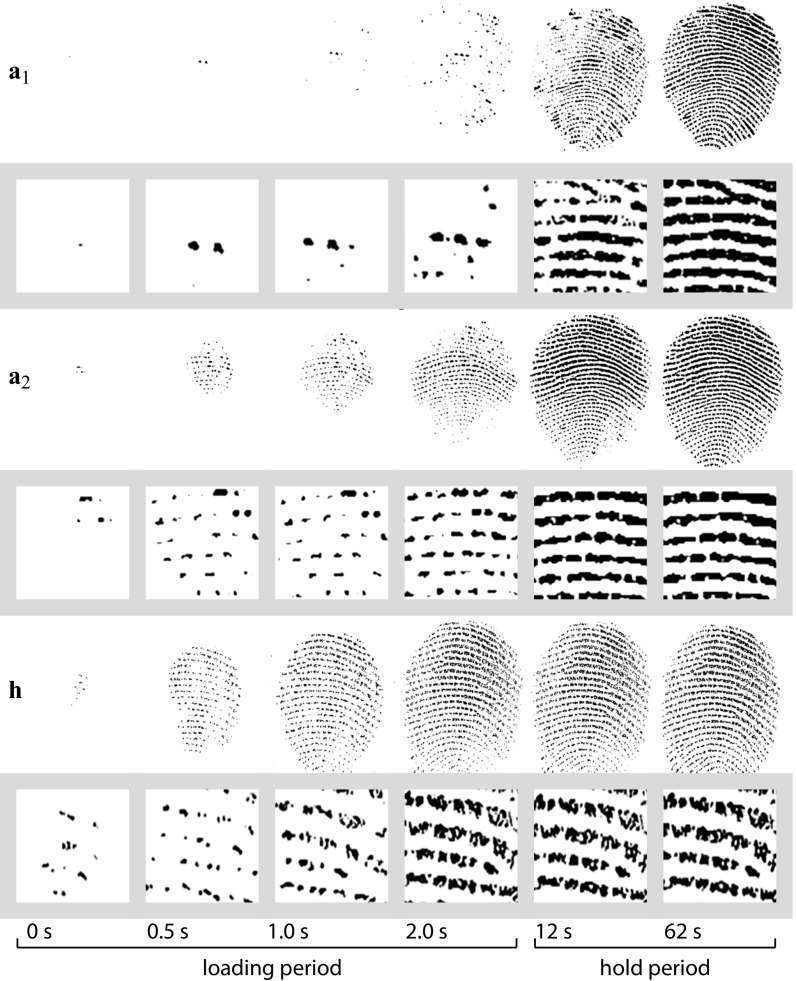
Fig. 1.
Temporal evolution of the contact area on a glass surface for participant A corresponding to trials a1 and a2 (Table 1). Each row is associated with framed enlarged image portions depicting the creation, growth, and coalescence of regions of the junction area. The last two rows show the contact evolution on a PDMS surface (Materials and Methods) under similar conditions for participant B, dataset h.

