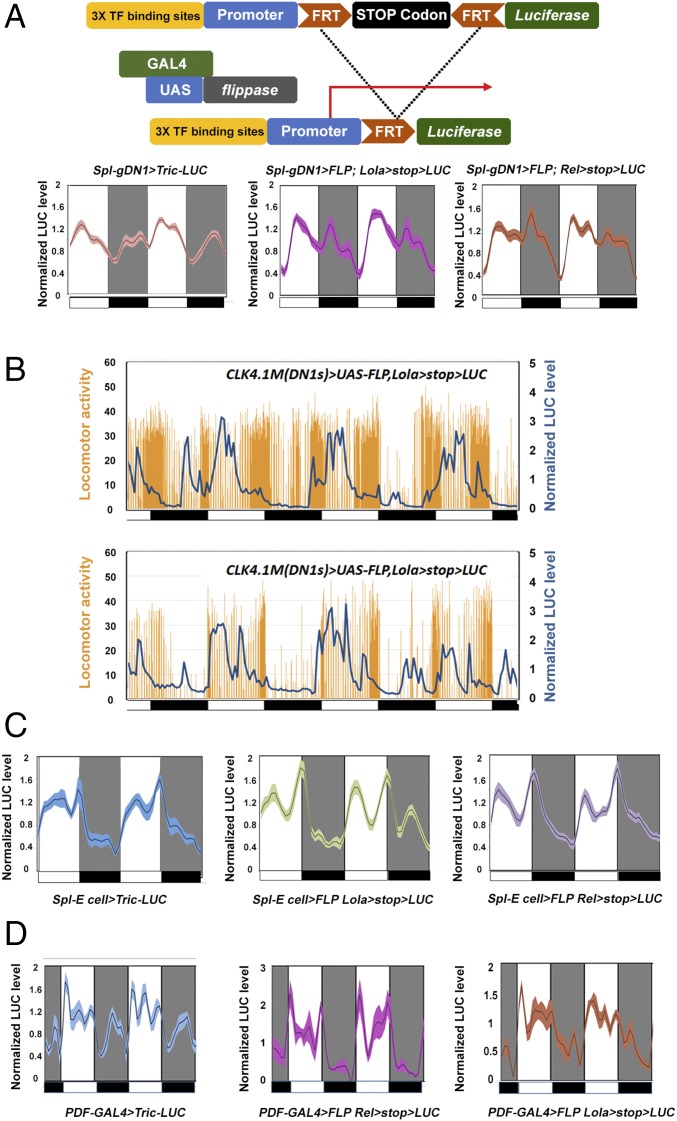
Fig. 5.
Comparing neuronal activity reporters and calcium reporters within the circadian neurons. (A) The neuronal activity reporters have a different pattern than Tric-LUC in the gDN1s. (Upper) Schematic of the neuronal activity reporters. (Lower) Comparison of the Tric-LUC reporter and the Relish-LUC as well as Lola-LUC reporters in gDN1s. Light and dark periods are indicated by white and gray backgrounds, respectively. n = 24 for the Spl-gDN1 > Tric-LUC group; n = 16 for the other groups. Shading correspond to SEM. (B) Real-time recording of gDN1 LUC and locomotor activity of individual flies. The comparison shows that DN1 LUC activity is negatively associated with fly daytime activity level. The locomotor activity (orange histogram) and the LUC activity (blue curve) of individual CLK4.1m(DN1s) > UAS-FLP,Lola > stop > LUC flies were recorded simultaneously for 4 d in LD. (Upper) Recordings from individual flies with relatively high locomotor activity levels. (Lower) Recordings from individual flies with relatively low locomotor activity levels. Black boxes and white boxes indicate dark and light periods, respectively. (C) The neuronal activity reporter patterns are indistinguishable from the Tric-LUC pattern in E cells. The panels show normalized LUC activity from Spl-E cell > UAS-Tric-LUC, Spl-E cell > UAS-FLP Lola > stop > LUC, and Spl-E cell > UAS-FLP Relish > stop > LUC groups. Light and dark periods are indicated by white and gray backgrounds, respectively. n = 24 for the Spl-E cell > Tric-LUC group; n = 16 for the other groups. Shading corresponds to SEM. (D) The neuronal activity reporter patterns are also indistinguishable from the Tric-LUC pattern in the PDF neurons. The panels show normalized LUC activity from PDF-GAL4 > UAS-Tric-LUC, PDF-GAL4 > UAS-FLP Lola > stop > LUC, and PDF-GAL4 > UAS-FLP Relish > stop > LUC groups. Light and dark periods are indicated by the white and gray backgrounds, respectively. n = 16 for each group. Shading corresponds to SEM.

