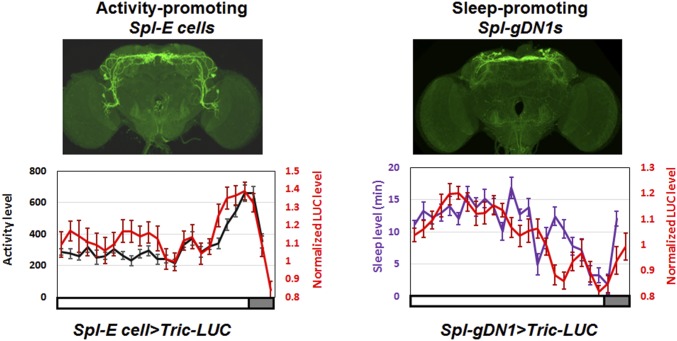
Fig. S3.
Daytime activity/sleep patterns track calcium levels within the two different circadian neuron groups. The red curve represents the real-time Tric-LUC level monitored by the TopCount NXT plate reader at 30-min intervals, and the black and purple curves represent the activity and sleep levels, respectively, recorded simultaneously by a webcam in the 96-well plate format. (Upper) The GAL4 expression patterns used in the experiment. The white and gray boxes below the figures indicate dark and light periods, respectively. A full 12-h light period is shown, followed by the beginning of the dark period. n = 20 for the Spl-E cell > Tric-LUC group (Left); n = 16 for the Spl-gDN1 > Tric-LUC group (Right). Error bars represent SEM.

