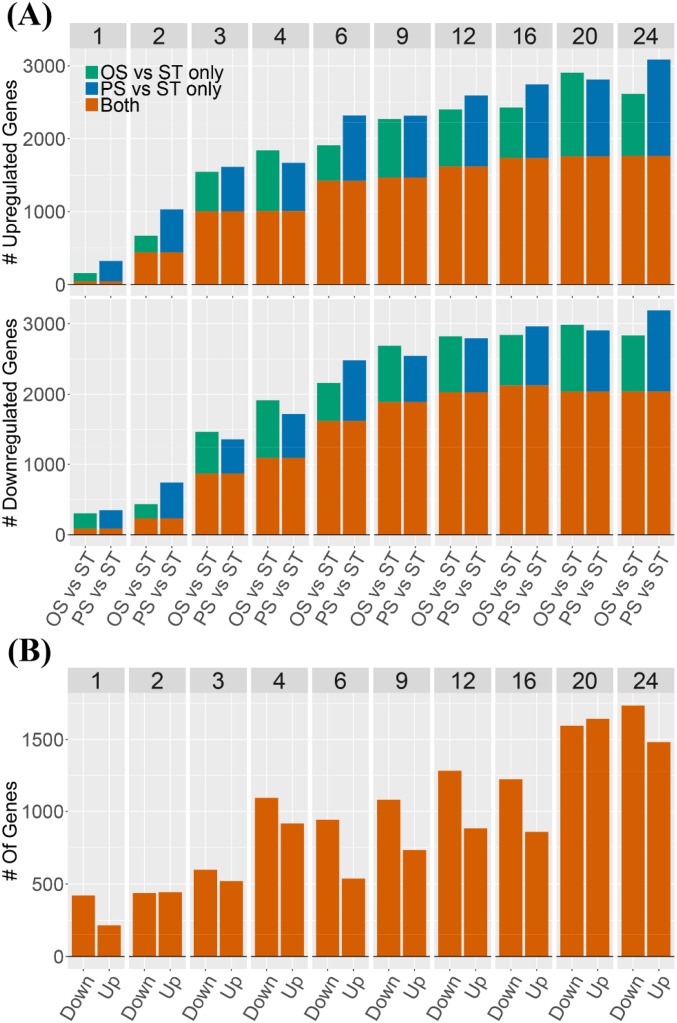
Fig. S1.
Number of DE genes. (A) Number of DE genes using the ST condition (hour 1) as control. (Upper) The number of up-regulated genes. (Lower) The number of down-regulated genes. In each panel, at each time point, the left and right bars show the number of DE genes for OS vs. ST and for PS vs. ST comparisons, respectively. (B) Number of DE genes in OS vs. PS. In each panel, at each time point, the left and right bars show the number of DE genes that are down-regulated and up-regulated in OS vs. PS, respectively.

