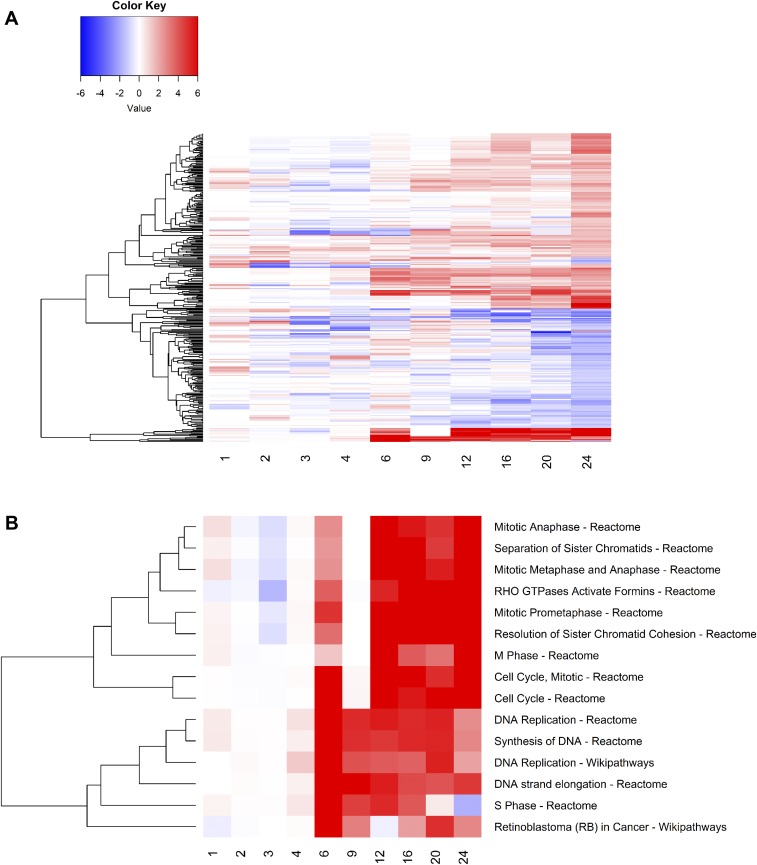
Fig. S2.
(A) Clustered heatmap of the log10 ratio of the P values in OS vs. ST and in PS vs. ST. Positive values indicate that PS has a smaller P value than OS; thus the pathway is more significantly enriched in PS. Negative values indicate the opposite. (B) When the heatmap is divided into two clusters (via hierarchical clustering), the smaller cluster shows a distinct difference in enrichment of several cell-cycle pathways starting around hour 6. This is particularly pronounced with many pathways relevant to S phase.

