Fig. 1.
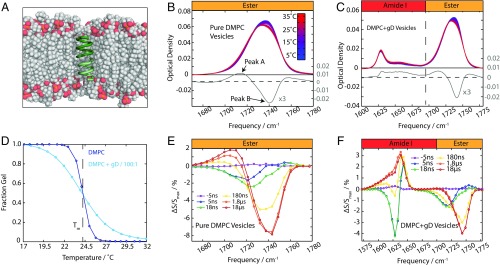
Monitoring the phase transition with IR spectroscopy. (A) gD embedded in a DMPC bilayer. Note the mismatch in between the length of gD and the bilayer thickness. (B) Temperature-dependent FTIR spectra of pure DMPC vesicles. The difference spectrum (T2 − T1, T2 = Tm + 5 °C, T2 = Tm − 5 °C) is shown in gray. (C) FTIR spectra of DMPC + gD vesicles. The difference spectrum is the same as in B. (D) Melting curves for DMPC and DMPC + gD vesicles. (E) Transient spectral response of pure DMPC vesicles in the ester region (Ti = 19 °C to Tf = 30 °C). (F) Transient spectral response of DMPC gD vesicles in the amide I and ester regions (Ti = 19 °C to Tf = 30 °C).

