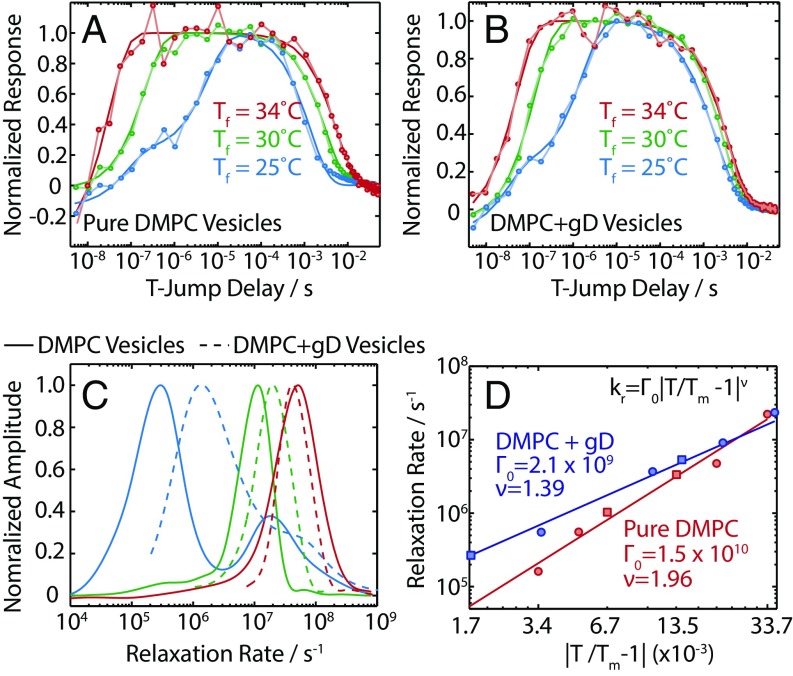
Fig. 2.
(A) Normalized kinetic traces for the loss of peak B (1,743 cm−1) for pure DMPC vesicles. (B) Normalized kinetic traces for the loss of peak B for DMPC + gD vesicles. (C) Rate distributions for the kinetic traces shown in A and B determined with the MaxEnt-ILT method. (D) Temperature dependence of τPT, and fit to a critical slowing model for pure DMPC and DMPC + gD vesicles. Squares indicate points where Tf < Tm, and circles indicate points where Tf > Tm.

