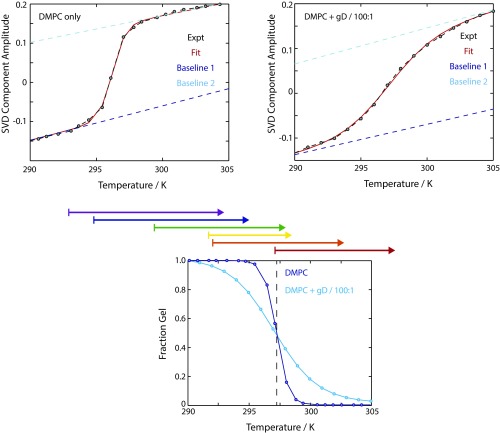
Fig. S1.
Melting curves obtained from the ester carbonyl region (1,690–1,780 cm−1) of pure DMPC vesicles (Left) and gD-containing vesicles (Right). Experimental data are plotted as black dashed lines, and the fit is modeled as a solid red line. Baselines are also shown. (Bottom) Comparison of the extracted gel fraction as a function of temperature for the two systems. Above this panel, arrows illustrate the T-jump ranges from Ti to Tf that are discussed in the main text. Expt., experiment.

