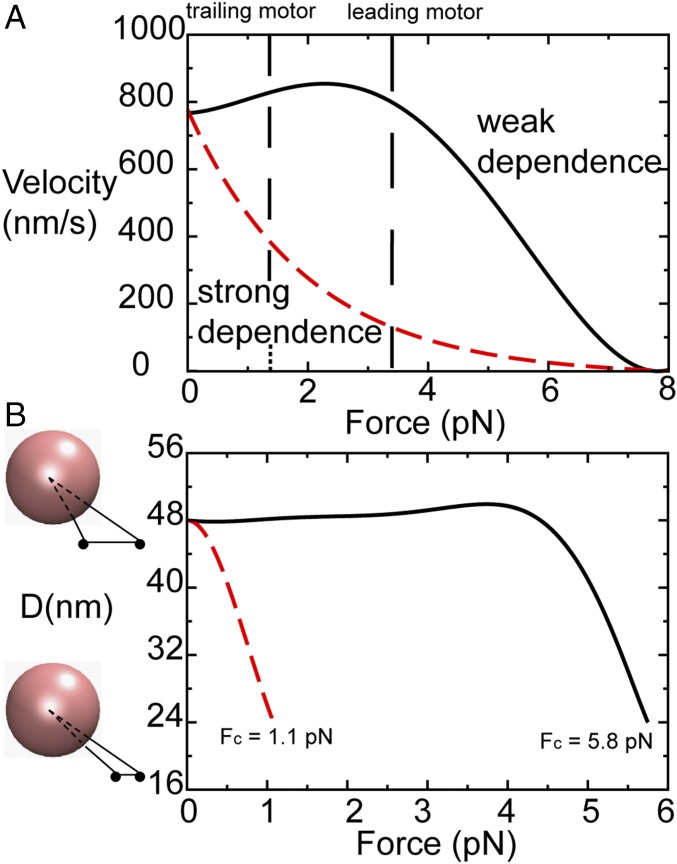
Fig. 4.
Numerical calculations on the distance between two load-bearing motor proteins as a function of loading force. (A) Two force–velocity relationships for motor proteins. The black solid curve is the numerically calculated force–velocity relationship for a single kinesin, as shown in Fig. 1D. This relationship represents the weak susceptibility of kinesin velocity to external loads. In contrast, the red dashed line shows a strong susceptibility. The vertical dashed lines correspond to the forces and velocities experienced by the leading motor and trailing motor in a two-motor load-sharing system. (B) Distance between two load-bearing motor proteins, D, as a function of the external loading force, F, calculated from the curves in A, with the computing procedure given in Numerical Calculations on the Distance Between Two Load-Bearing Motor Proteins as a Function of Loading Force. Fc denotes the total force on the two interacting kinesins in a triangular configuration when the two are at the smallest separation on an MT, reaching a possibly highest cooperativity. For the black curve (weak susceptibility), Fc is 5.8 pN. For the red curve (strong susceptibility), Fc is 1.1 pN.

