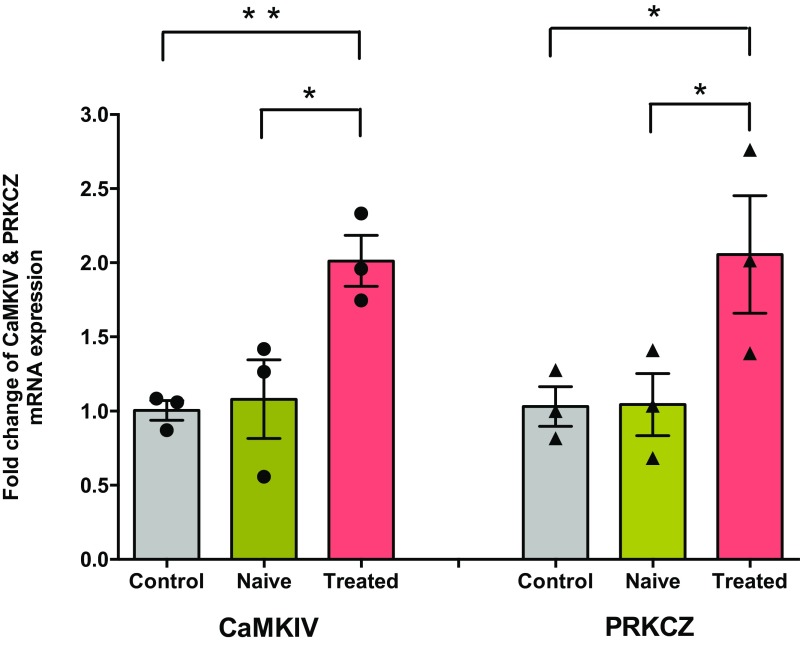
Fig. S6.
CaMKIV and PRKCZ mRNA expression levels in the CA2 region of hippocampus after SP treatment: qRT PCR analysis shows that CaMKIV and PRKCZ mRNA expression were significantly increased in the CA2 region of hippocampus after SP treatment compared with untreated control slices and snap-frozen rat hippocampus. Significant difference between groups (control vs. SP-treated, naïve rat hippocampus vs. SP-treated) are indicated by *P < 0.05 or **P < 0.01 (slices from three biological replicates). Individual data points of fold change are represented within the bar graphs.

