Fig. 5.
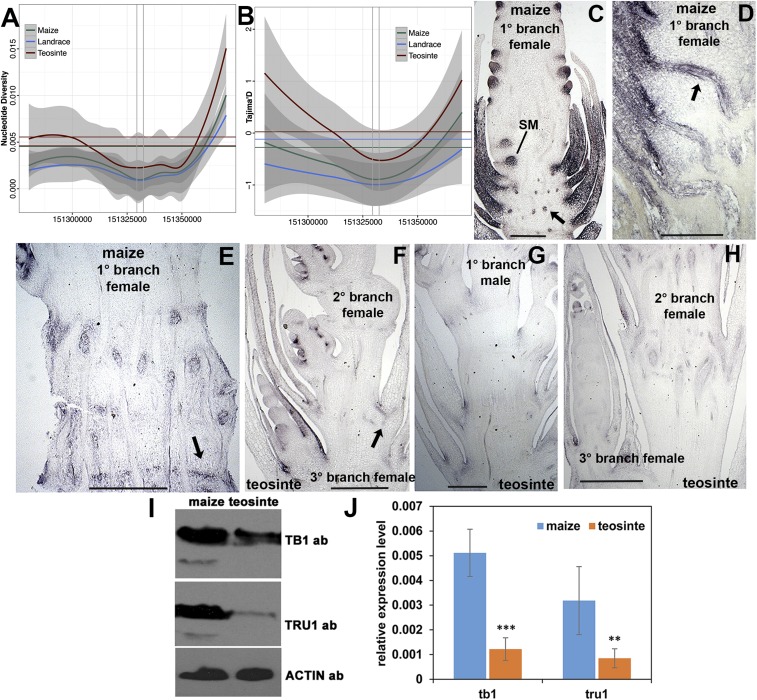
Analysis of tru1 in maize and Z. mays parviglumis. (A) Nucleotide diversity and Tajima’s D test (B) for the region surrounding the tru1 locus of improved maize, maize landraces, and teosinte. Base-pair positions are relative to AGPv4 of the maize reference genome. Vertical gray lines indicate the transcript start and end points of tru1. Gray bands denote 95% confidence intervals. Horizontal lines indicate genome-wide averages. (C–H) TRU1 immunolocalization. (C) Immature primary axillary branch of maize corresponding to the female ear primordium showing expression at base of SM, husk leaves, and transverse sections of leaf traces (arrow). (D) Close-up of shank of immature maize ear primordium showing expression in longitudinal sections of vascular traces (arrow) connecting to husk leaves. (E) Older maize ear shank showing continued expression in leaf traces and internode cells (arrow). (F) Immature female secondary and tertiary axillary branches of teosinte at floret and spikelet pair stages, respectively. Reduced expression is seen in leaf trace (arrow) as well as leaves. (G) Immature male primary axillary branch of teosinte with reduced expression in shank. (H) Closeup of older secondary and tertiary female branches of teosinte shank showing reduced expression in husk leaves and differentiated vasculature. (I) Western blot of whole protein extracts from flowering maize and teosinte ear shank tissue probed with TB1 and TRU1 antibodies. Anti-actin antibody was used as a loading control. (J) qRT-PCR of the same tissue in I. Actin was used as an internal control. **P < 0.01, ***P < 0.001 by Student’s t test. (Scale bars: C and D, ∼500 μm; E–H, ∼1,000 μm.)

