Figure 2.

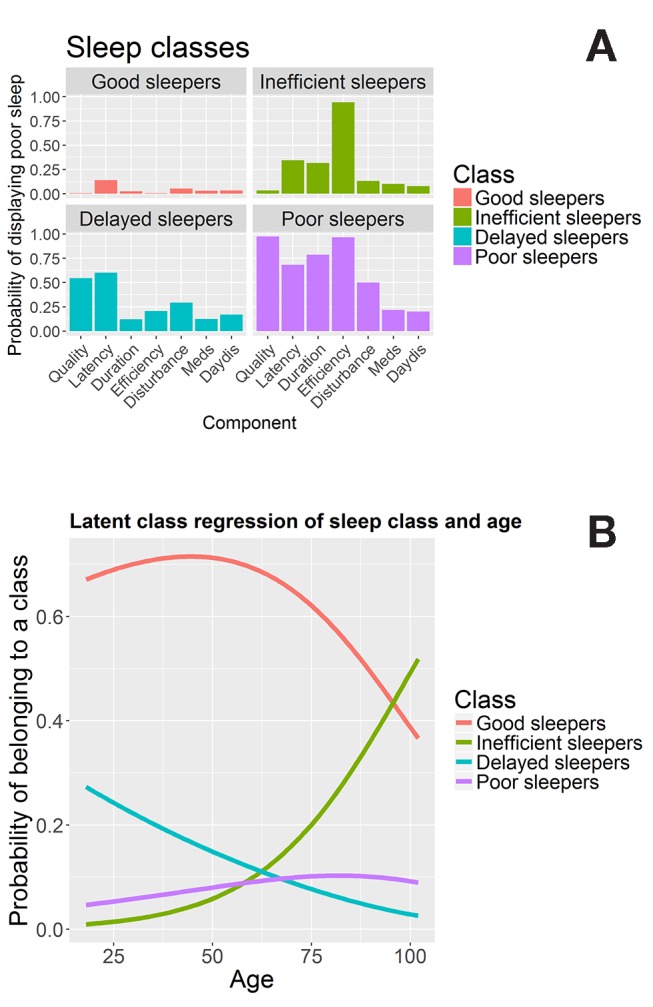
Latent class analysis. Panel (A) shows the sleep quality profiles for each of the four classes. Panel (B) shows the conditional probability of belonging to each class across the lifespan.

Latent class analysis. Panel (A) shows the sleep quality profiles for each of the four classes. Panel (B) shows the conditional probability of belonging to each class across the lifespan.