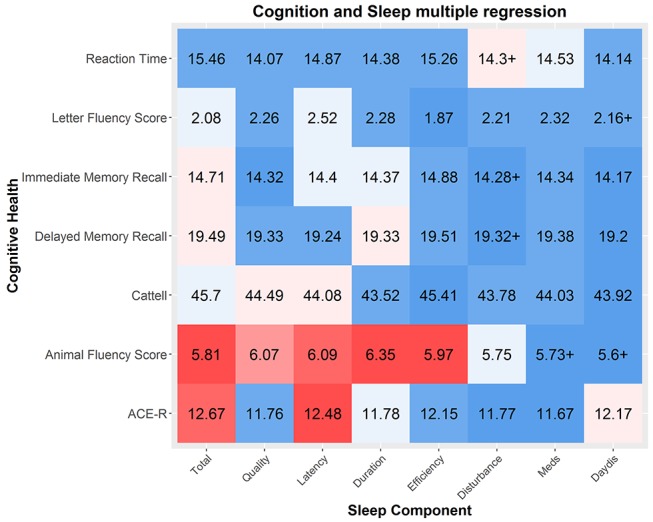
Figure 3.

Multiple regressions between sleep components and cognitive health. The strength of the effect is colour coded by Bayes factor and the effect size is shown as r-squared (as a percentage out of 100). Sample varies across components and measures due to varying missingness. Cattell and reaction time were measured only in the imaging cohort: mean N=648, N=11.11. Sample sizes for five other domains are similar (mean n=2300.25, SD=65.57). ACE-R, Addenbrooke's CognitiveExamination Revised.
