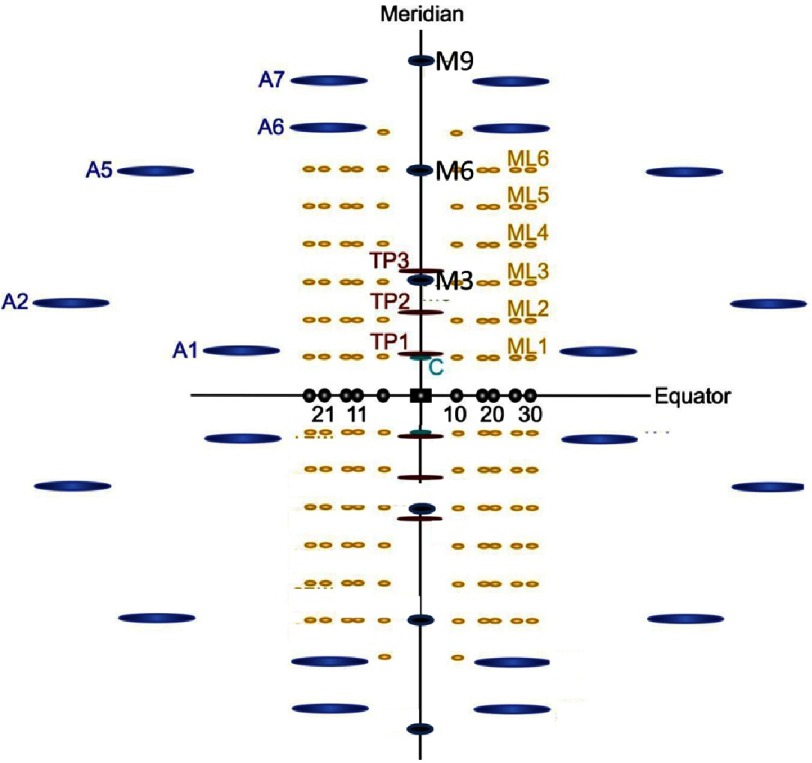
Figure 16. Schematic representation of an X-ray diffraction pattern from a fish muscle (Harford & Squire, 1986[p]).
The right and left portions of the pattern are related by mirror symmetry about the meridian and the top and bottom by mirror symmetry across the equator. The equatorial reflections (marked with indices 10, 11, 20, 21, and 30; see the 10 and 11 in Figure 9(a)) are shown in black and are produced by radiation scattered from both the myosin and the actin filaments at right angles to the fibre axis. The yellow layer-line reflections are produced only by the myosin filaments and are labelled ML1 to ML6 (ML stands for Myosin Layer-line). They relate to successive orders of a ‘d’ spacing in Bragg’s Law of 43 nm. The layer lines in blue are produced by the actin filaments (orders of d ∼ 36 nm) and are labelled A1 to A7 (A stands for Actin reflections). The main meridional reflections, in green, named M3, M6 and M9 (M for Myosin; orders of d = 14.3 nm) tell us about the one dimensional projection of the density of the myosin heads onto the muscle fibre axis (heads/ crossbridges on myosin and, in active or rigor muscle, heads on actin too). Reflections on the meridian labelled TP1 to TP3 (orders of d = 38.5 nm), are from the regulatory protein troponin on the actin filaments (see Figure 2(a)) and are shown in red. Figure courtesy of Dr. Carlo Knupp.

