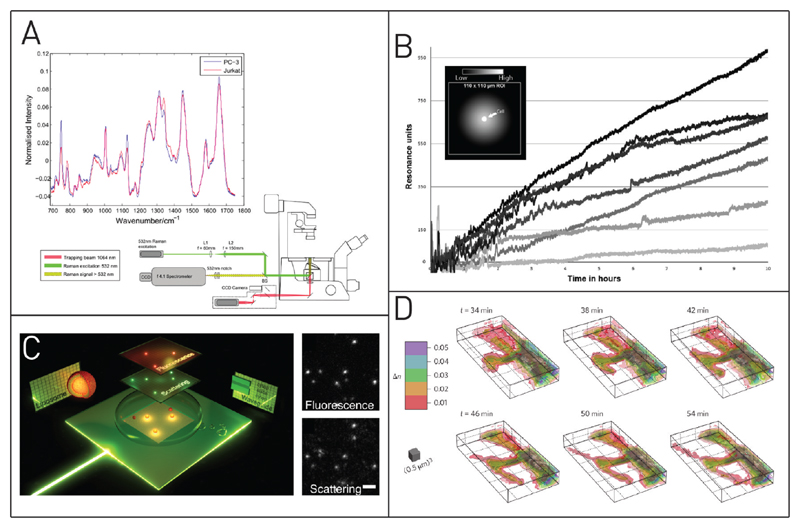
Figure 3. Label-free optical analysis methods for single cells.
(A) Raman spectroscopy on the single-cell level discriminates live epithelial prostate cells and lymphocytes. Adapted with permission from Casabella, S.; Scully, P.; Goddard, N.; Gardner, P. Analyst 2016, 141, 689–696 (ref 118). Published by The Royal Society of Chemistry. (B) Single-cell secretion of anti-EpCAM antibodies quantified by surface plasmon resonance. The slopes of the curves represent the differences in the production rate of the individual cells. Adapted with permission from Stojanović I.; Van Der Velden, T. J. G.; Mulder, H. W.; Schasfoort, R. B. M.; Terstappen, L. W. M. M. Anal. Biochem. 2015, 485, 112–118 (ref 121). Copyright 2015 Elsevier. (C) Evanescent light scattering microscope for detection of fluorescent and label-free particles. Adapted from Agnarsson, B.; Lundgren, A.; Gunnarsson, A.; Rabe, M.; Kunze, A.; Mapar, M.; Simonsson, L.; Bally, M.; Zhdanov, V. P.; Höök, F. ACS Nano 2015, 9, 11849–11862 (ref 124). Copyright 2015 American Chemical Society. (D) Time-lapsed 3D live-cell tomography showing the refractive index change during filopodia formation of a neuronal spine. Adapted with permission from Cotte, Y.; Toy, F.; Jourdain, P.; Pavillon, N.; Boss, D.; Magistretti, P.; Marquet, P.; Depeursinge, C. Nat. Photonics 2013, 7, 113–117 (ref 125). Copyright 2013 Nature Publishing Group.

