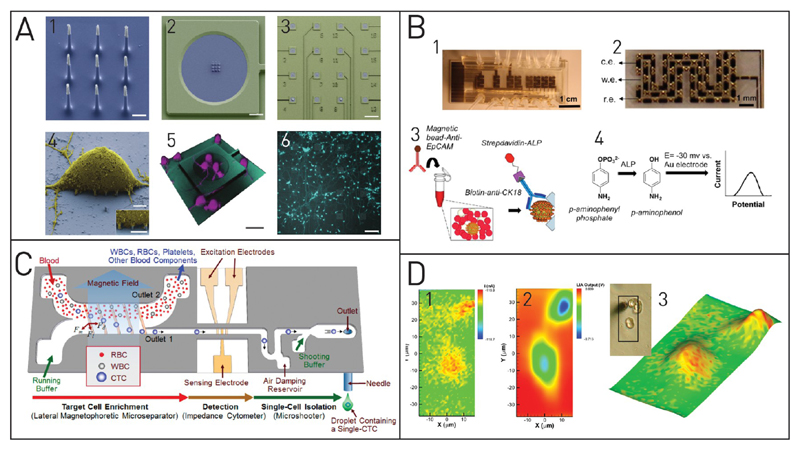
Figure 4. Electrochemical single-cell analysis techniques.
(A) Nanowires (1: SEM image, scale bar 1 μm) can penetrate single cells for electrical measurements. Sixteen individual measurement arrays are placed on one chip (2 and 3, scale bars 10 and 120 μm). Images 4–6: SEM image of rat cortical cell on the vertical electrode array, confocal reconstruction, and top view on calcein AM stained cells. Adapted with permission from Robinson, J. T.; Jorgolli, M.; Shalek, A. K.; Yoon, M.-H.; Gertner, R. S.; Park, H. Nat. Nanotechnol. 2012, 7, 180–184 (ref 130). Copyright 2012 Nature Publishing Group. (B) A microfluidic chip with eight independent sensors (1) comprising of X-shaped posts (2) and on-chip electrodes are used to capture cancer cells from a given sample. Dielectrophoretic cell capture is followed by cell labeling (3) and electrochemical detection (4). Adapted from Safaei, T. S.; Mohamadi, R. M.; Sargent, E. H.; Kelley, S. O. ACS Appl. Mater. Interfaces 2015, 7, 14165–14169 (ref 136). Copyright 2015 Americal Chemical Society. (C) Impedance spectroscopy is used in this microfluidic platform to detect single CTCs after magnetic separation. If a cell is detected, external processing evokes an actuation of the microshooter to print this cell onto a microtiter plate for further analysis. Adapted from Kim, J.; Cho, H.; Han, S.-I.; Han, K.-H. Anal. Chem. 2016, 88, 4857–4863 (ref 141). Copyright 2016 American Chemical Society. (D) Scanning electrochemical microscopy images of PC12 cells. To generate the images, a microelectrode is scanned over the sample and the amperometric current and the impedance signals are measured. Analysis of the topography (1) and oxygen consumption (2) of the cell can be achieved at the same time (3). Adapted from Koch, J. A.; Baur, M. B.; Woodall, E. L.; Baur, J. E. Anal. Chem. 2012, 84, 9537–9543 (ref 142). Copyright 2012 American Chemical Society.

