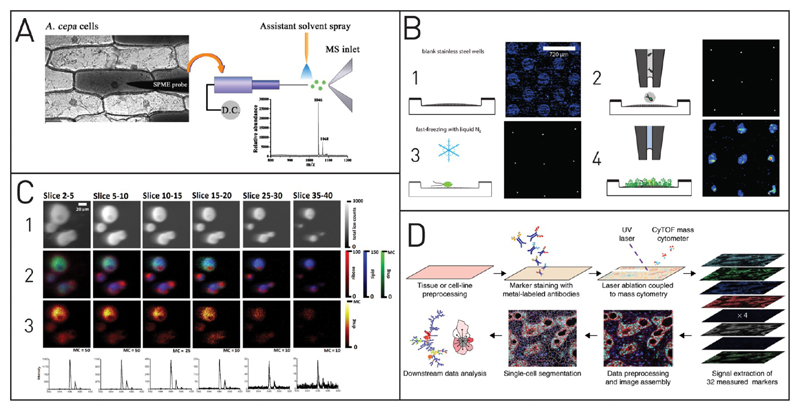
Figure 5. Mass spectrometry for single-cell analysis.
(A) Cytosol analysis by ESI-MS. A tiny microcapillary withdraws part of the cytosol and transfers it to the MS, where it is ionized and analyzed. Reprinted from Gong, X.; Zhao, Y.; Cai, S.; Fu, S.; Yang, C.; Zhang, S.; Zhang, X. Anal. Chem. 2014, 86, 3809–3816 (ref 156). Copyright 2014 American Chemical Society. (B) MALDI-MS platform for investigations of single cells that were spotted into microwells. Adapted with permission from Krismer, J.; Sobek, J.; Steinoff, R. F.; Fagerer, S. R.; Pabst, M.; Zenobi, R. Appl. Environ. Microbiol. 2015, 81, 5546–5551 (ref 159). Copyright 2015 American Society for Microbiology. (C) Label-free 3D-TOF-SIMS measurement of amiodarone-doped macrophages at different sputter depths. Many different molecules can be visualized by selecting the corresponding m/z ratio (1–3). The different slice numbers represent the sputtered z-stacks for the 3D imaging. Adapted from Passarelli, M. K.; Newman, C. F.; Marshall, P. S.; West, A.; Gilmore, I. S.; Bunch, J.; Alexander, M. R.; Dollery, C. T. Anal. Chem. 2015, 87, 6696–6702 (ref 160). Copyright 2015 American Chemical Society. (D) Mass cytometry achieves high sensitivities by employing rare earth metal tags. The isotopically pure tags allow simultaneous detection of more than 40 different targets. Besides cytometers, imaging systems based on this approach have been developed as well. Reprinted with permission from Giesen, C.; Wang, H. A. O.; Schapiro, D.; Zivanovic, N.; Jacobs, A.; Hattendorf, B.; Schuffler, P. J.; Grolimund, D.; Buhmann, J. M.; Brandt, S.; Varga, Z.; Wild, P. J.; Günther, D.; Bodenmiller, B. Nat. Methods 2014, 11, 417–422 (ref 161). Copyright 2014 Nature Publishing Group.

