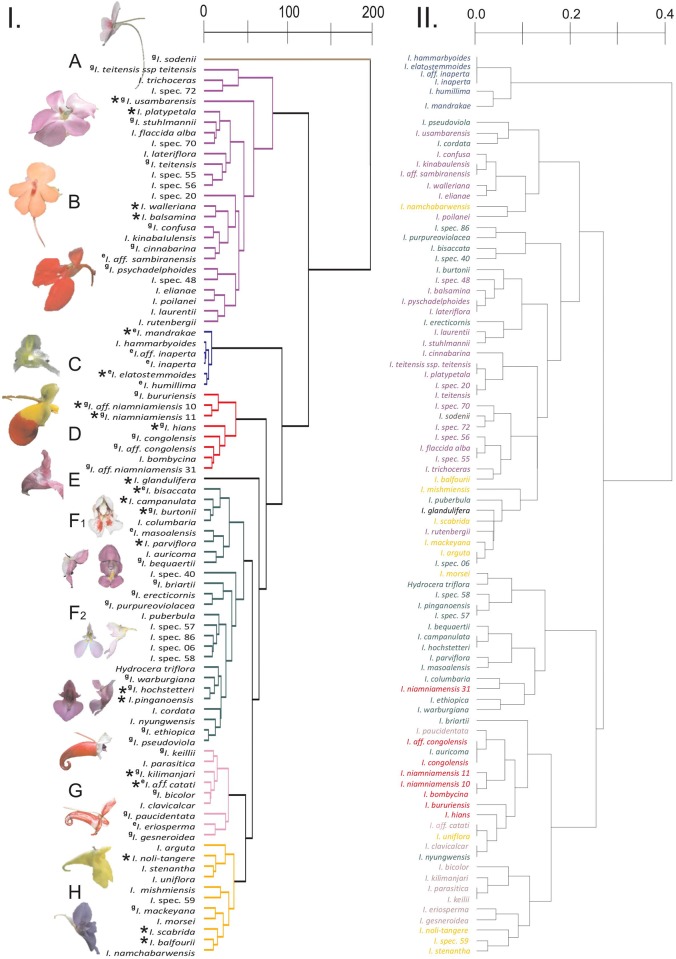
Fig 3. Cluster analyses generated from distance matrices (I.) based on quantitative and (II.) based on categorical flower morphometry, signal and nectar traits.
Pollination syndromes are assigned to the clusters of I. based on syndrome assignments by Grey-Wilson [37] (g) and Erpenbach [45] (e) as well as pollinator observations for individual species (*) from the literature: A: hawkmoth; B: butterfly; C: generalist fly; D: bird 1; E: large bee (Apidae); F1 and F2: non-syndrome (containing several syndromes); G: bird 2; H: large bee (Apidae; tribes Anthophorini, Apini, Bombini). Coloration of the species in II. is based on the coloration of the clusters in I. In contrast to Grey-Wilson [37] we assigned the hawkmoth syndrome to Impatiens sodenii, based on the 12.8 cm long spur and the largest frontal display size of all analysed species. In contrast to Erpenbach [45] we assigned the generalist fly syndrome to I. inaperta and I. aff. inaperta since we analysed only open, non-cleistogamous flowers.

