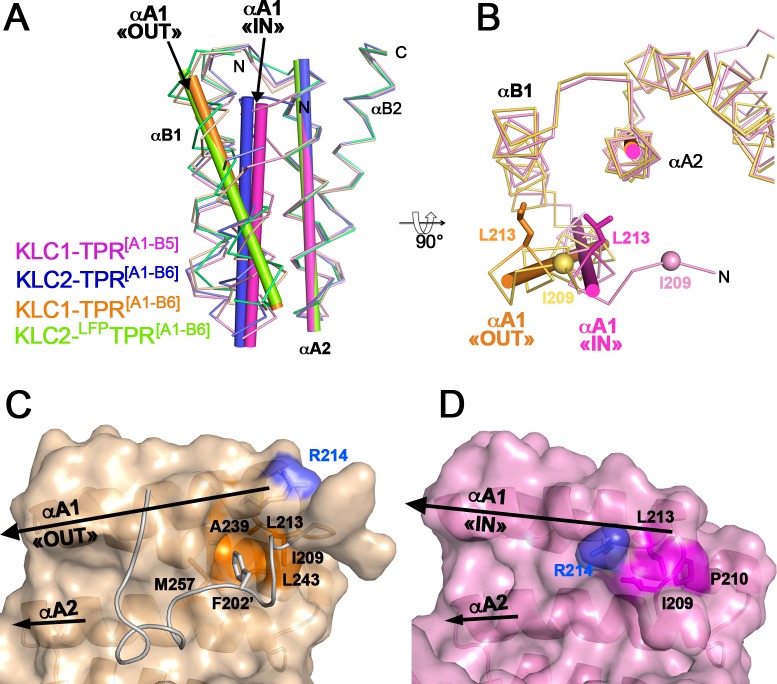
Fig 4. The N-terminal capping A1 helix exhibits two distinct positions.
(A) Superposition of KLC1-TPR[A1-B5] (this study; pink), KLC1-TPR[A1-B6] (3NF1, orange), KLC2-TPR[A1-B6] (this study, blue) and KLC2-LFPTPR[A1-B6] (5FJY, green). TPR domain superposition is done on the TPR2 motif. (B) Orthogonal view of the superposition between KLC1-TPR[A1-B5] (this study; pink), and KLC1-TPR[A1-B6] (3NF1, orange). Residue L213 is shown in sticks. (C-D) Surface representation of the TPR1-TPR2 motifs of KLC1-TPR[A1-B6] (3NF1, orange) and KLC1-TPR[A1-B5] (this study, pink) with the same orientation. This view faces the groove. Residues forming the αA1/αA2 hydrophobic pocket are colored in orange. The His-tag linker is shown in ribbon (grey) and its Phe202* is indicated in sticks. The positive charge group of Arg214 is shown in blue. Both A1 and A2 helices are highlighted by black arrows.

