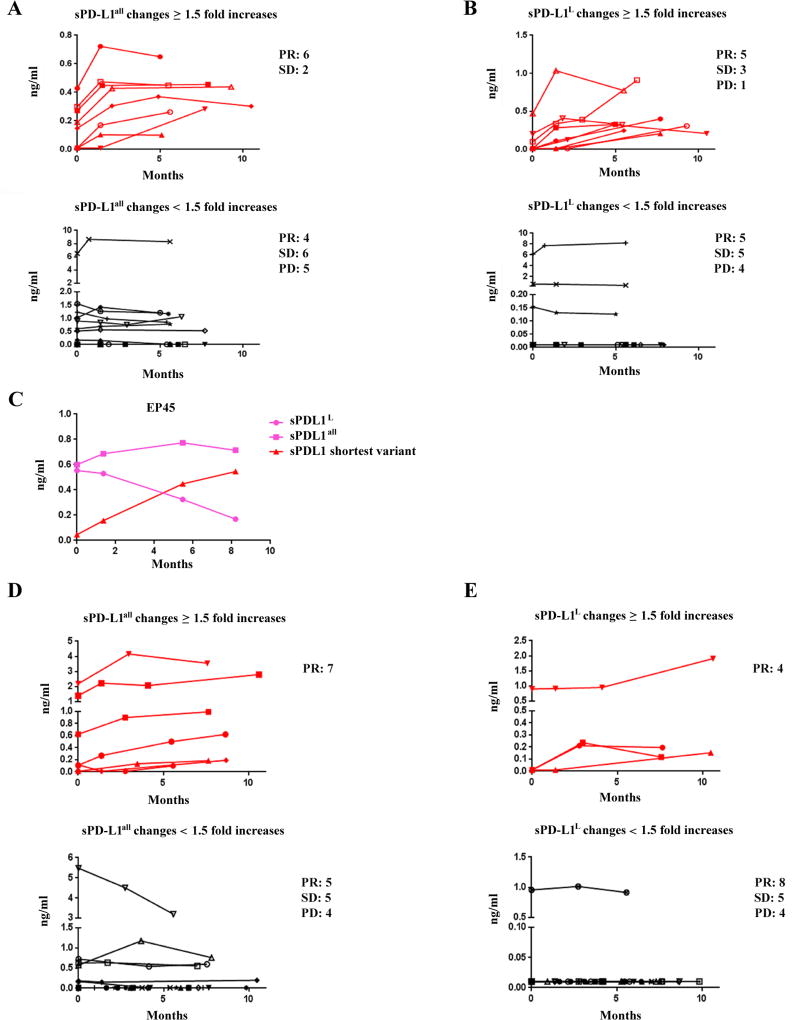
Figure 6.
sPD-L1 in sera of melanoma patients receiving either ipilimumab in ECOG 1608 trial or anti–PD-1 antibody. A and B. Comparision between long term or delayed increases and non increase in sPD-L1 in melanoma patients receiving ipilimumab. C. Different charectors in secretion of sPD-L1 in patient EP45 after ipilimumab treatment. D and E. Comparision between long term or delayed increases and non increase in sPD-L1 in melanoma patients receiving anti–PD-1 antibody. Red line indicates a greater than 1.5-fold increases in sPD-L1 after 5 months of treatment, and black line indicates < 1.5-fold increases in sPD-L1 after 5 months of treatment (shown in A, B, D, and E). Pink lines represent changes of sPD-L1all and sPD-L1L, and a red line stands for a greater than 1.5-fold increases in the shortest sPD-L1 variant (shown in C). Fisher exact tests were performed based on window from 5 to 11 months post-treatment (Supplemental Fig. S13G and S13H, and Supplemental Fig. S14G and S14H). P < 0.05 are considered statistically significant.

