
Figure 2.
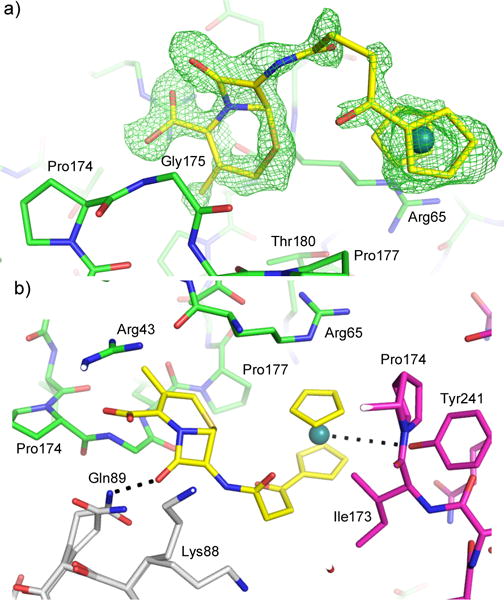
Intact compound 3 (yellow) observed at the crystal-packing interface. (A) The unbiased Fo-Fc density map is shown in green at 3σ. (B) Interactions between compound 3 and three protein monomers. Monomers 1, 2, and 3 are colored in green, white, and magenta respectively. Potential hydrogen bonds are shown as black dashed lines.